
Posts

Showing 13 - 24 of 151 Posts
  • Abstract attribution visualization featuring intersecting infinity-shaped signal paths and waveform patterns flowing across a horizontal axis. Blue, purple, and orange data streams converge at a central point, symbolizing the interaction of multiple marketing touchpoints, customer journeys, and attribution models used to assign conversion credit across channels.
    AnalyticsDataAdvertisingStrategy

    Attribution

    Understand how attribution connects GA4, UTMs, ads, SEO analytics, conversion tracking, reporting, and better decisions.

  • Featured image for Prompt Engineering showing a ChatGPT-style conversation interface containing a structured prompt template with placeholders for role, task, context, audience, goal, constraints, format, examples, and review criteria. The interface appears on a dark futuristic background with subtle digital wave patterns and cyan neon highlights.
    AIContentAutomationStrategy

    Prompt Engineering

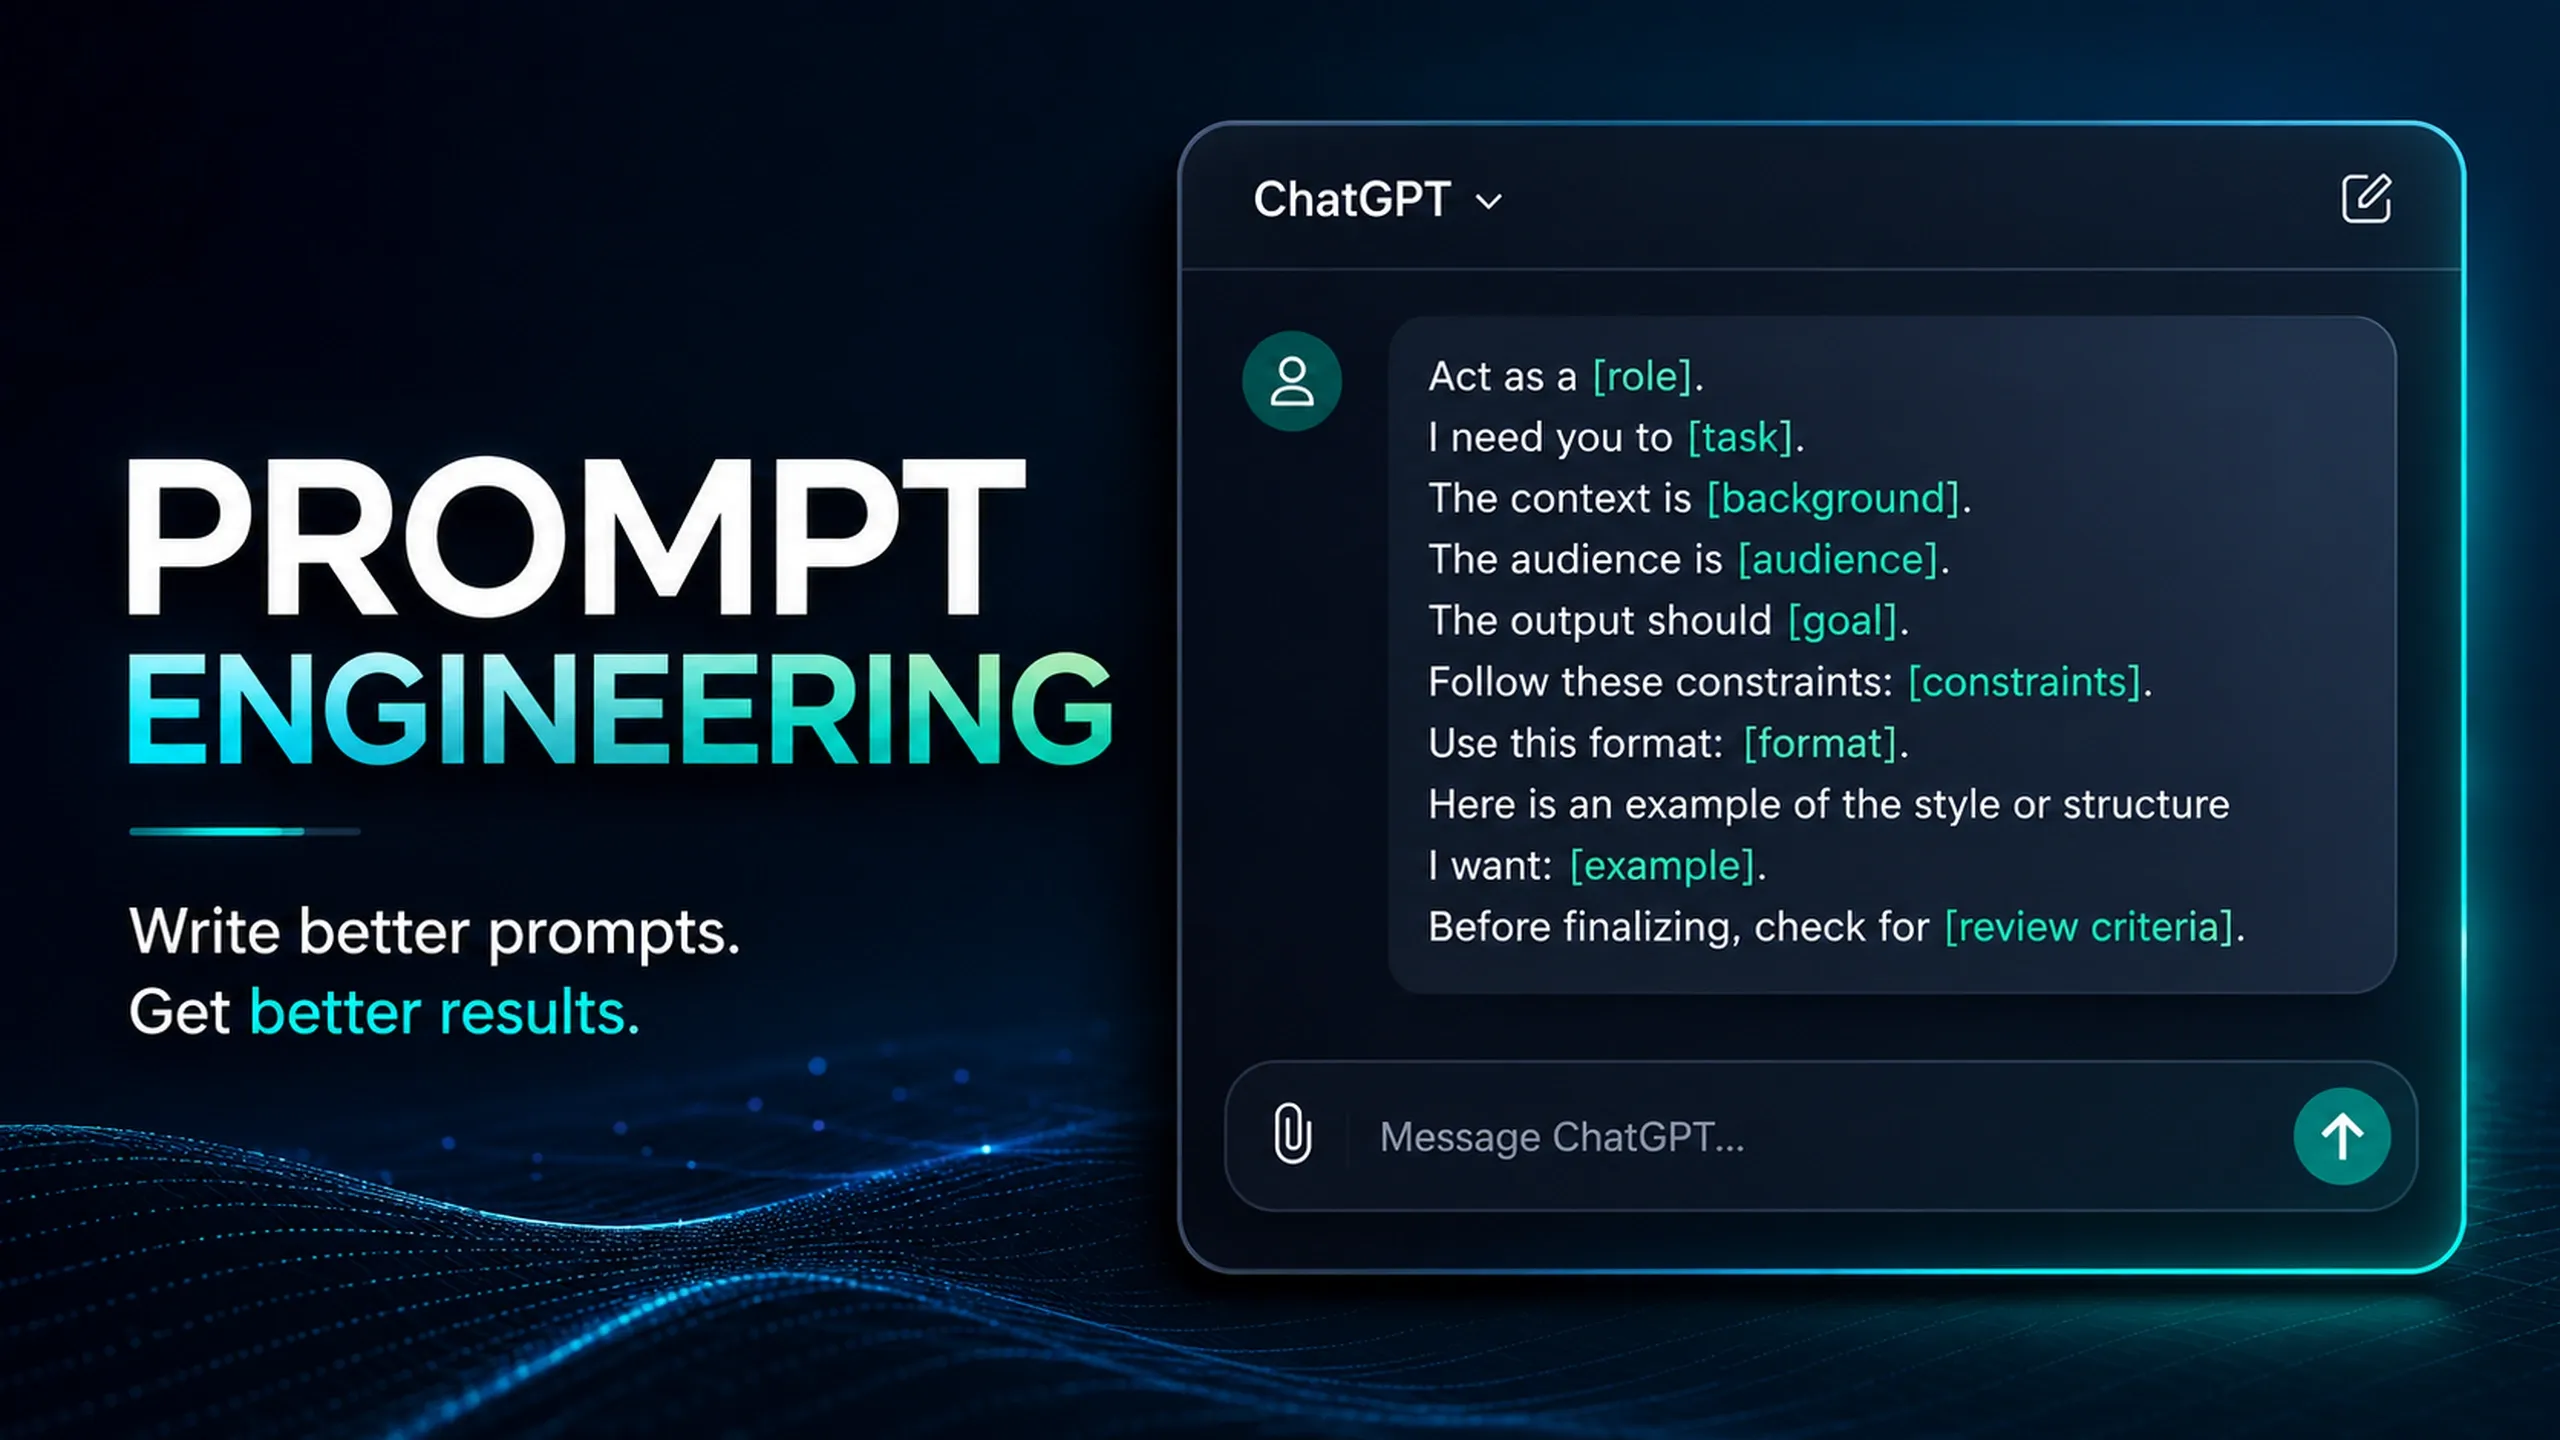
    Learn how prompt engineering improves AI outputs through clearer tasks, context, constraints, examples, and review.

  • Visualization of a webhook event trigger sending real-time notifications from a source application to multiple connected systems, services, and databases whenever an event occurs.
    IntegrationAutomationTechnicalSystem

    Webhooks

    Learn how webhooks send event notifications, validate payloads, handle retries, and keep system workflows reliable.

  • Illustration of a middleware layer positioned between multiple systems, databases, cloud services, applications, and users, acting as a central integration hub that coordinates communication and data exchange.
    IntegrationSystemTechnicalAutomation

    Middleware

    Learn how middleware routes, transforms, validates, monitors, and governs data flow between connected systems and workflows.

  • Google Tag Manager workspace dashboard displayed in a modern browser interface, showing tags, triggers, variables, workspace changes, and publishing controls, surrounded by blue data streams and tag management visual elements.
    AnalyticsTechnicalDevelopment

    Google Tag Manager

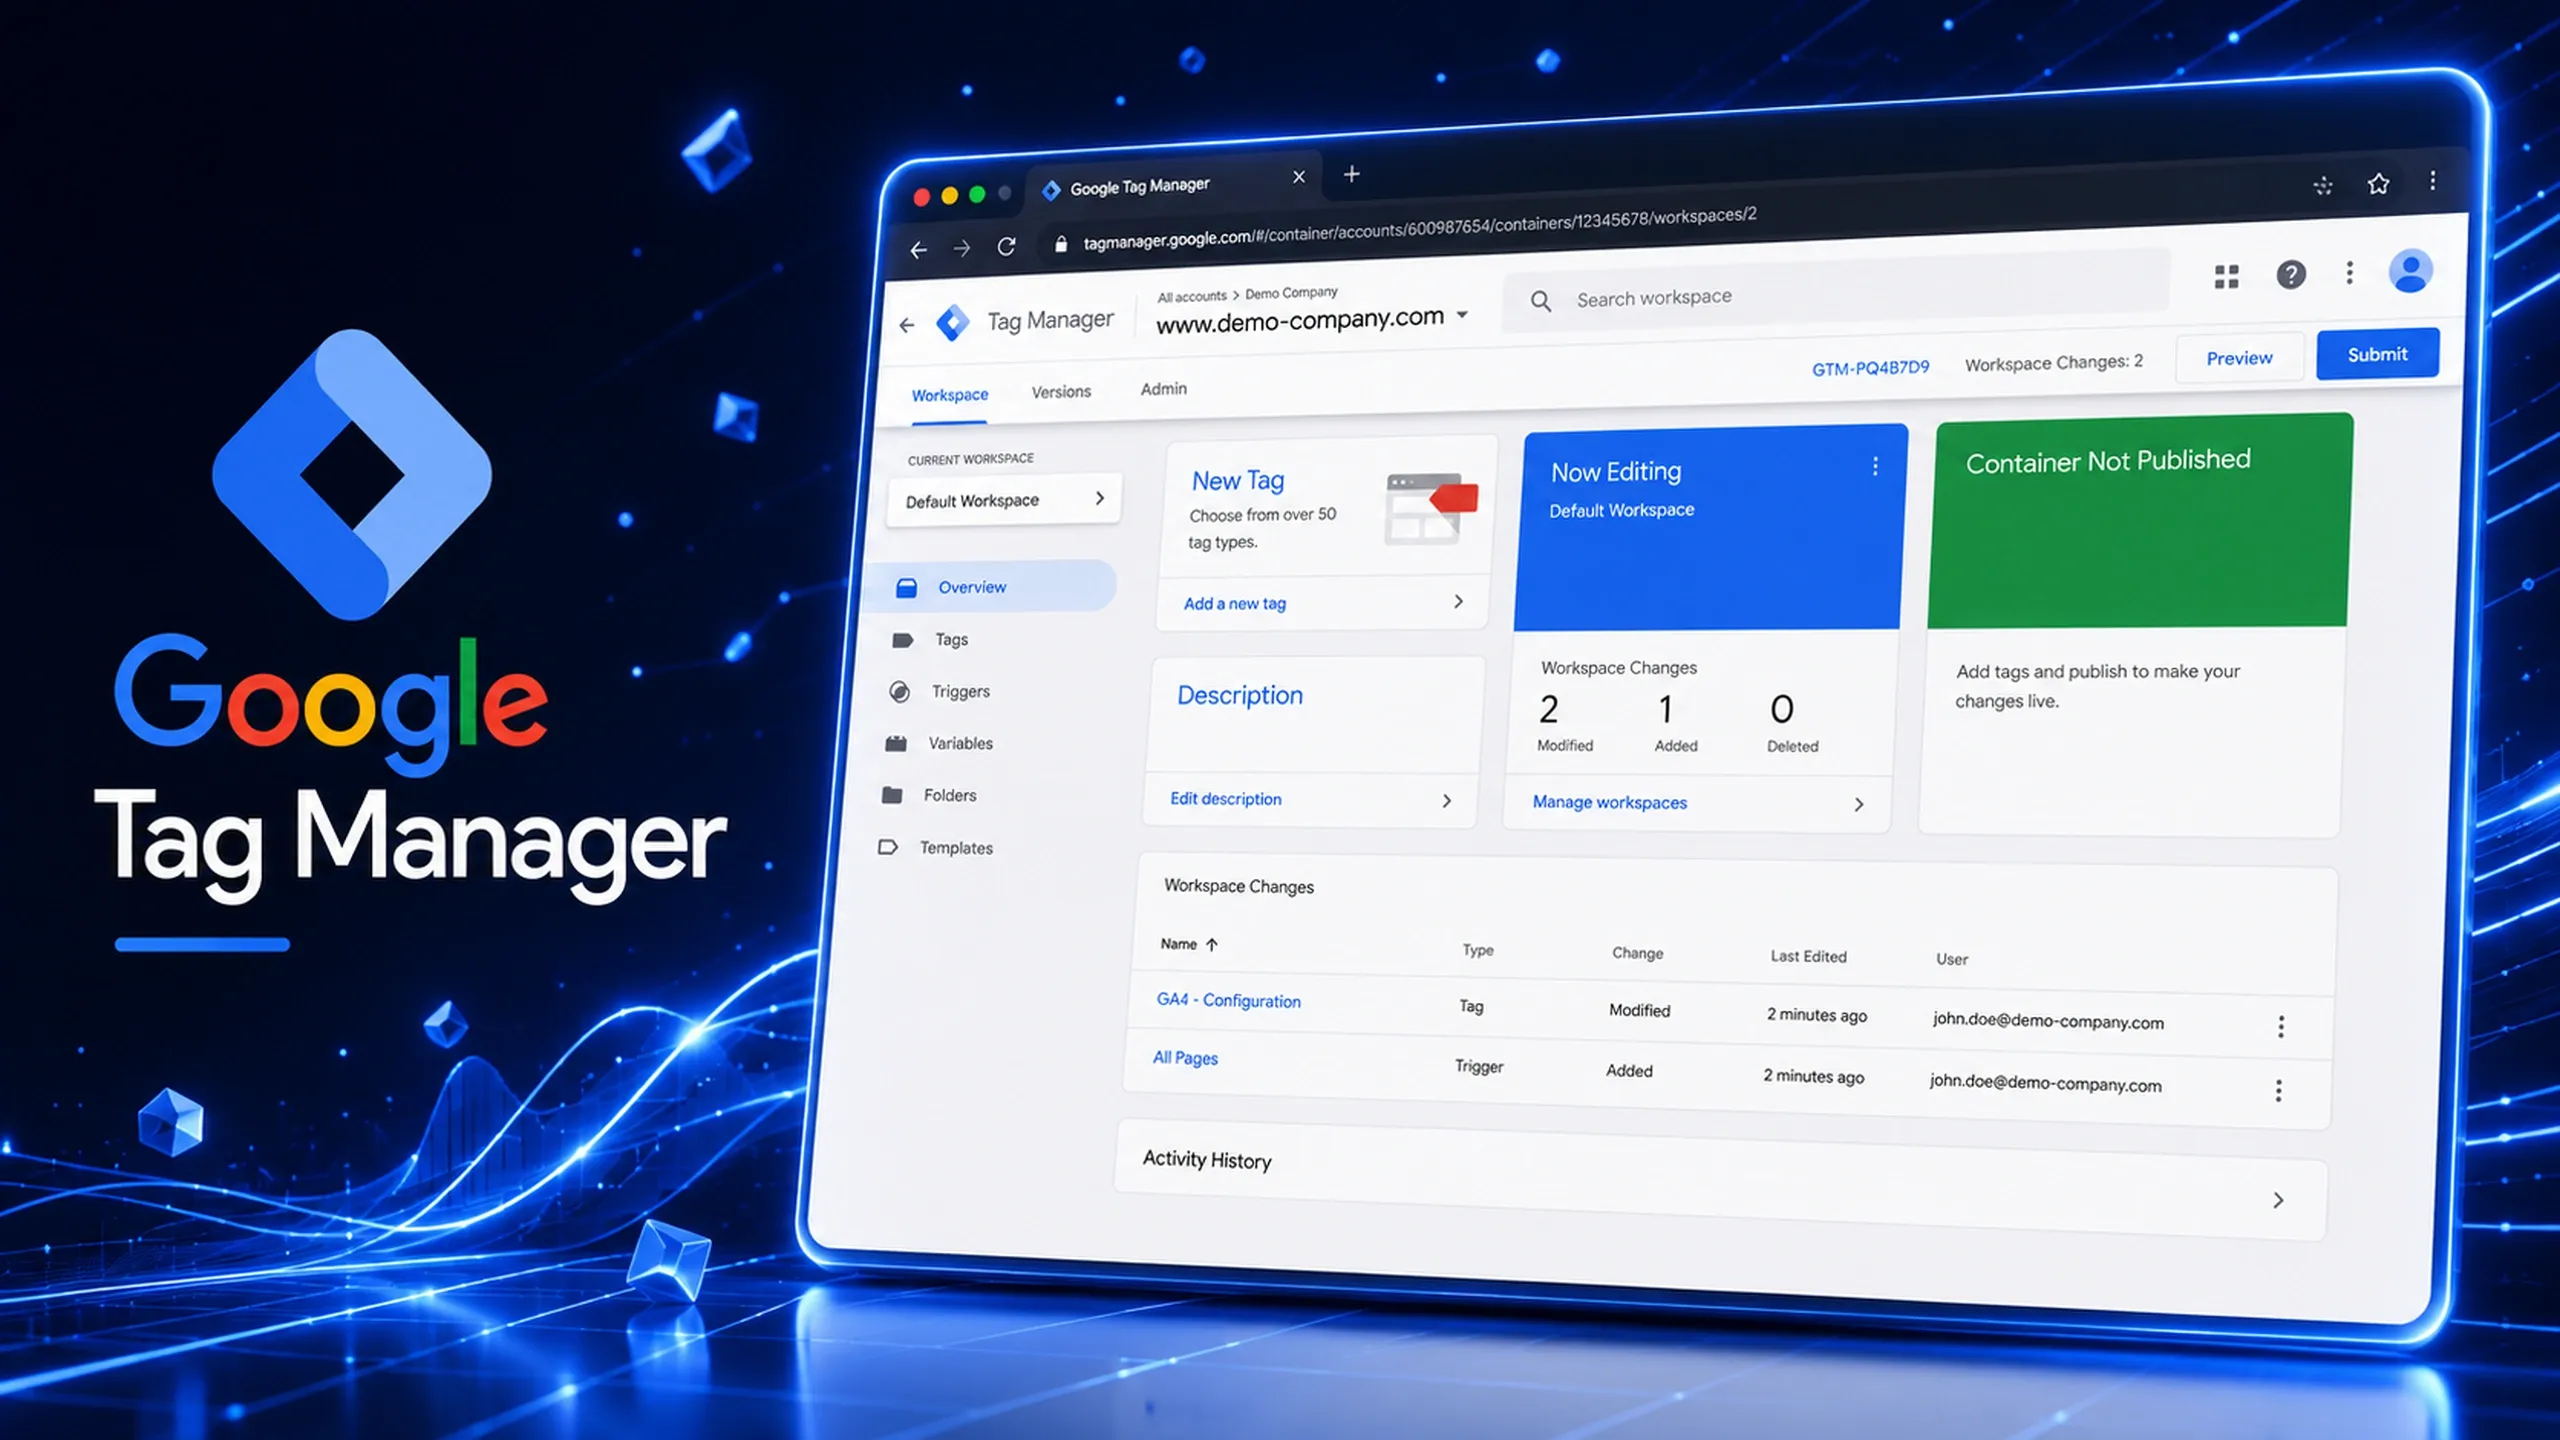
    Learn how Google Tag Manager manages tags, triggers, variables, data layers, consent, and tracking governance for cleaner measurement.

  • Google Analytics 4 dashboard displayed inside a modern browser interface, showing user acquisition, engagement, revenue, and traffic reports with orange data streams and glowing analytics-inspired visual effects.
    AnalyticsPerformanceData

    Google Analytics 4

    Learn how GA4 measures events, key actions, traffic sources, campaigns, and user behavior through a structured analytics setup.

  • Futuristic editorial illustration of the Google Search Console dashboard showing SEO performance metrics, clicks, impressions, indexing trends, and technical monitoring tools inside a glowing browser interface with neon blue and purple highlights.
    AnalyticsSEOData

    Google Search Console

    Learn how Google Search Console helps monitor indexing, search performance, technical SEO issues, queries, clicks, and visibility.

  • Futuristic neon illustration of a digital advertising bidding strategy system showing a glowing auction gavel, live bid pricing, conversion and impression metrics, and performance graphs representing automated auction logic, bid optimization, and budget control in paid media campaigns.
    AdvertisingPerformanceAnalyticsStrategy

    Bidding Strategy

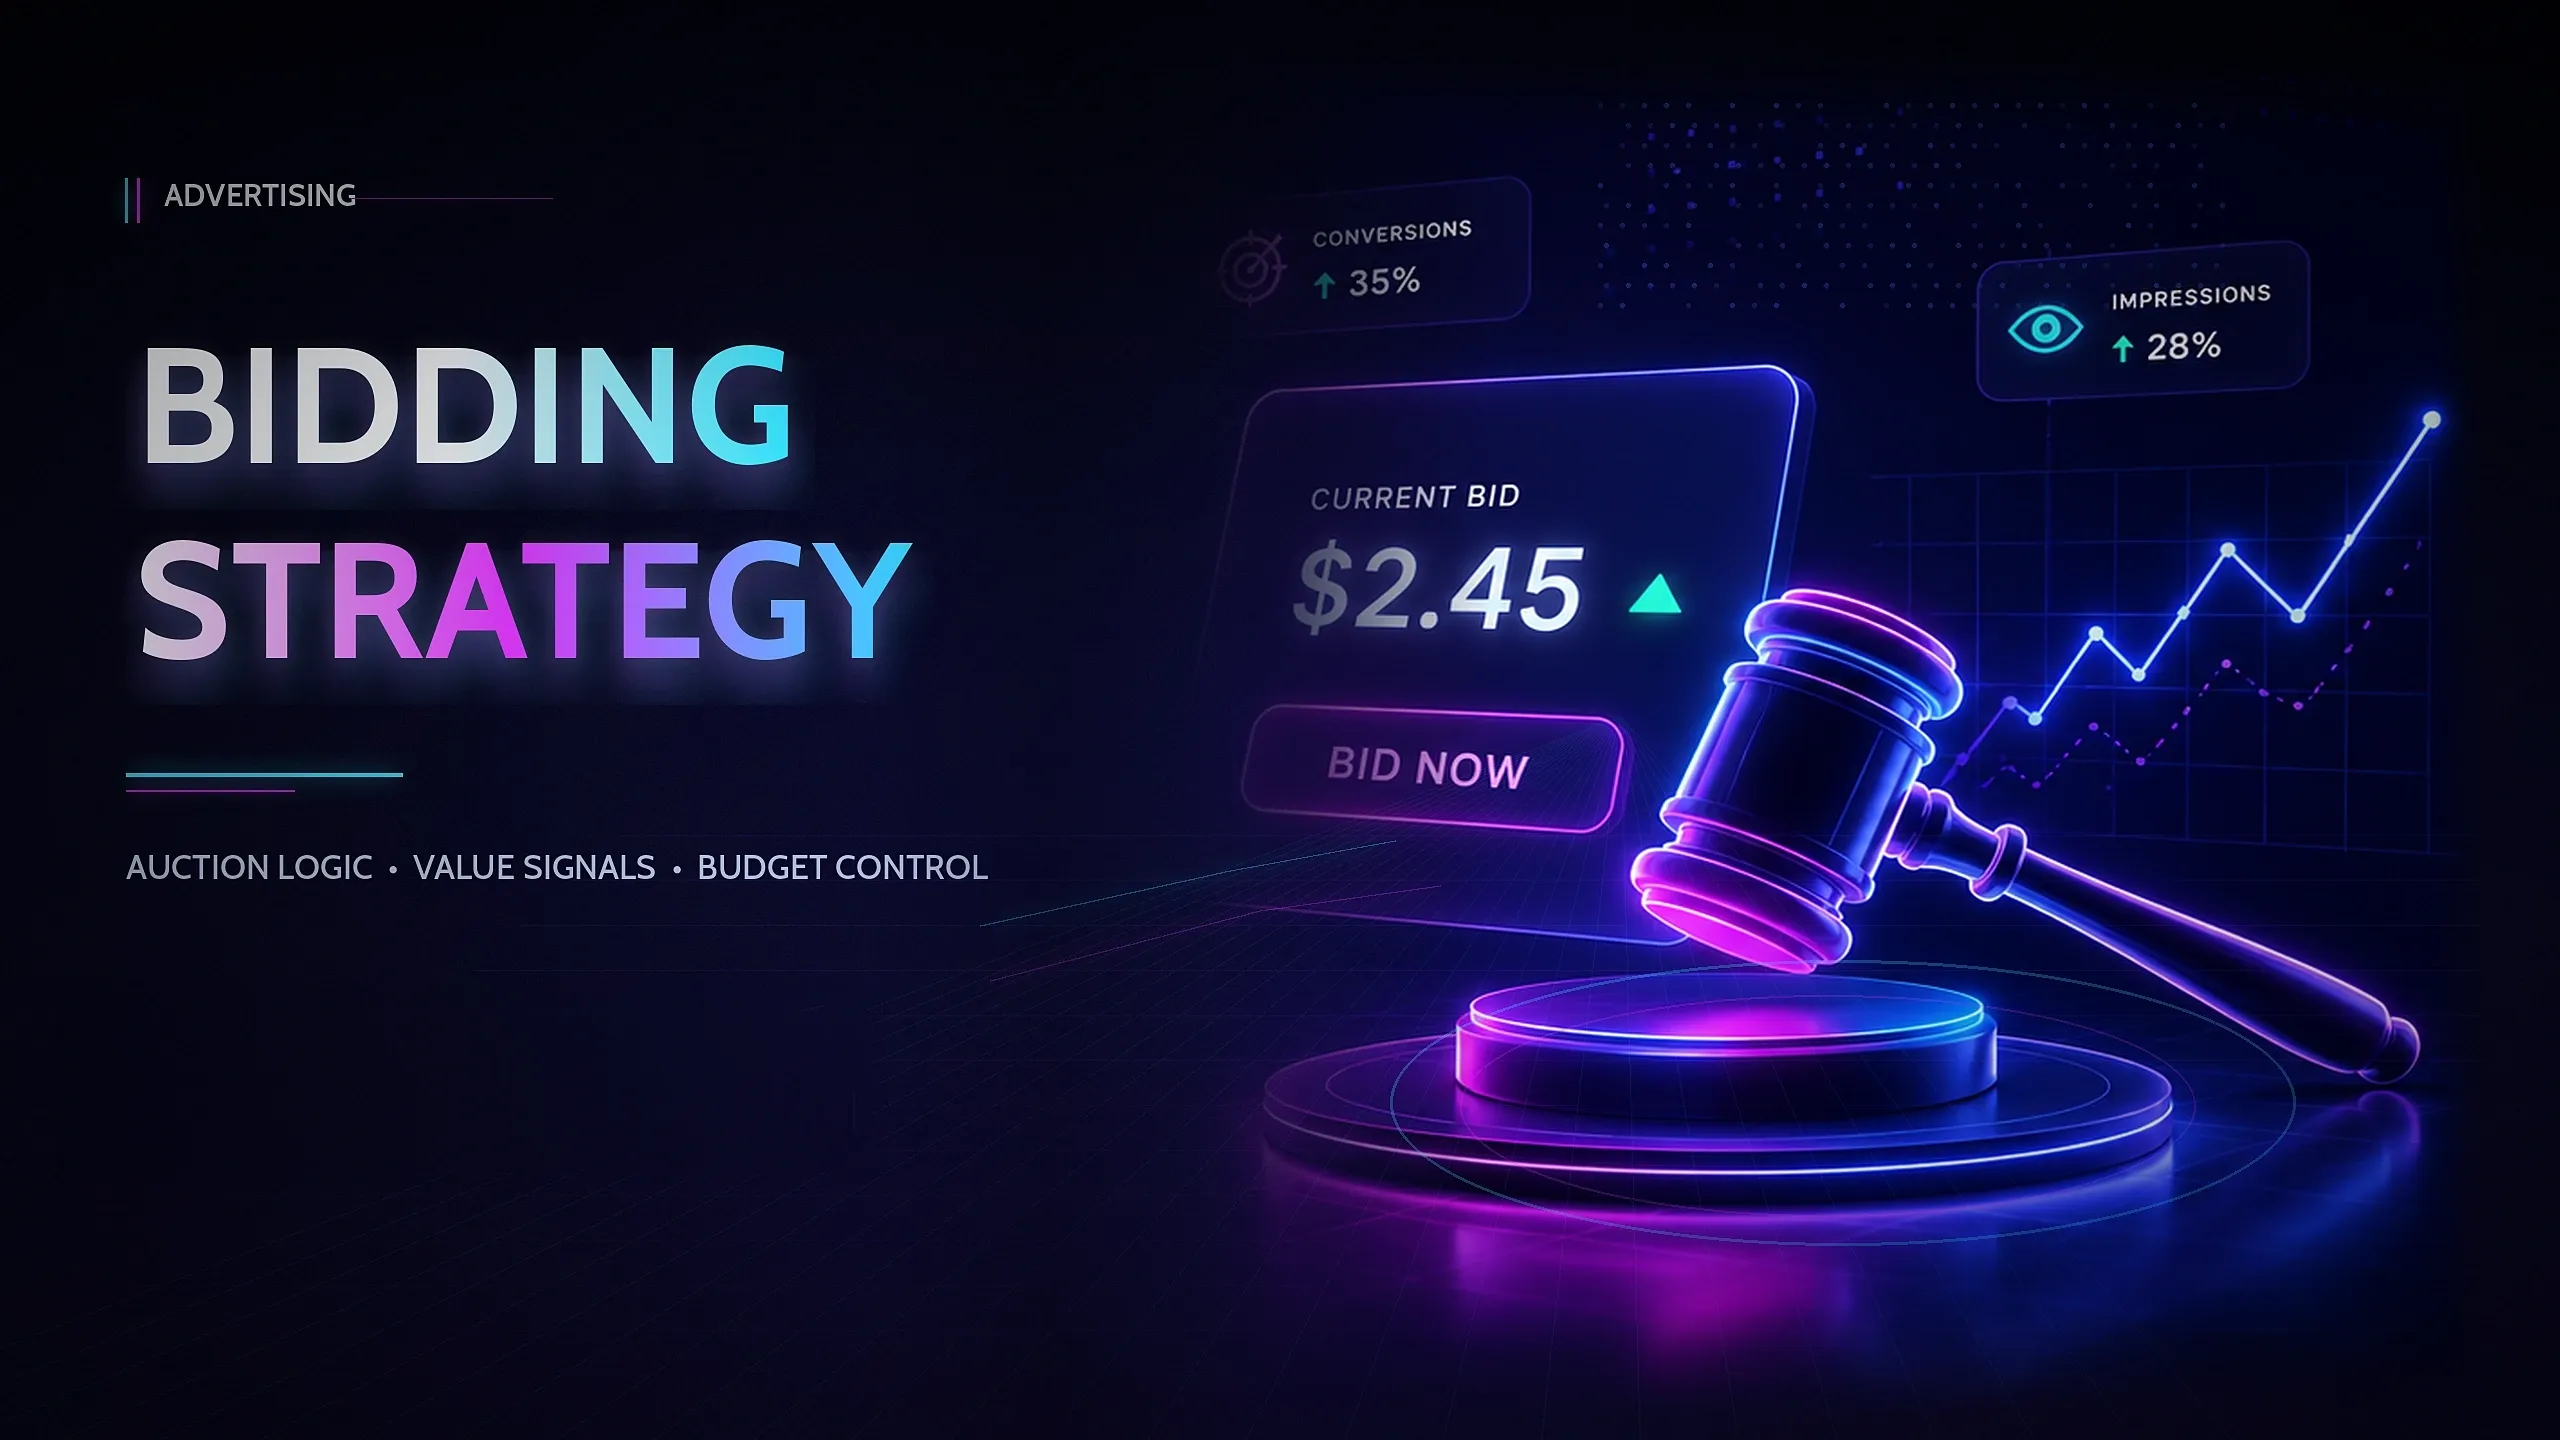
    Learn how bidding strategy shapes ad auctions, budgets, conversions, value, and campaign efficiency across paid media platforms.

  • Futuristic conversion tracking illustration showing user interaction events flowing through a tracking layer toward measurable business outcomes including purchases, sign-ups, leads, and bookings.
    AnalyticsConversionAdvertisingData

    Conversion Tracking

    Learn how conversion tracking measures leads, sales, bookings, values, and key actions so campaigns optimize toward real business outcomes.

  • Neon-style event tracking illustration showing user interactions such as clicks, views, scrolls, form submissions, and video plays flowing into an analytics processing layer and centralized data storage system.
    AnalyticsDataTechnicalConversion

    Event Tracking

    Learn how event tracking measures user actions, conversions, errors, and journey steps so analytics can support better decisions.

  • Dynamic page speed illustration featuring a large glowing speedometer integrated into a website interface, with blue and orange motion trails representing fast-loading web performance and acceleration.
    WebsitePerformanceTechnicalDevelopment

    Page Speed

    Learn how page speed affects SEO, UX, and conversions, and how to improve loading, interactivity, media, scripts, and site performance.

  • Dark editorial illustration showing a glowing blue API puzzle piece connecting four surrounding systems represented by cloud infrastructure, databases, user systems, and development/code modules.
    IntegrationTechnicalSystemData

    API Integration

    Learn how API integration connects CRM, ERP, CRS, databases, and automation into reliable business systems.