
Posts

Showing 1 - 12 of 147 Posts
  • Illustration of a caching system where multiple content requests are routed through a cache layer before reaching the origin server, demonstrating how cached data reduces repeated server processing and improves content delivery speed.
    WebsitePerformanceTechnicalDevelopment

    Caching

    Learn how caching improves speed, CDN delivery, HTTP headers, freshness, invalidation, CMS workflows, SEO, and privacy control.

  • Diagram illustrating a content taxonomy structure where content is organized into topics, categories, resources, blog sections, and informational pages, showing how content relationships support navigation, discovery, and scalability.
    ArchitectureContentDataWebsite

    Taxonomy

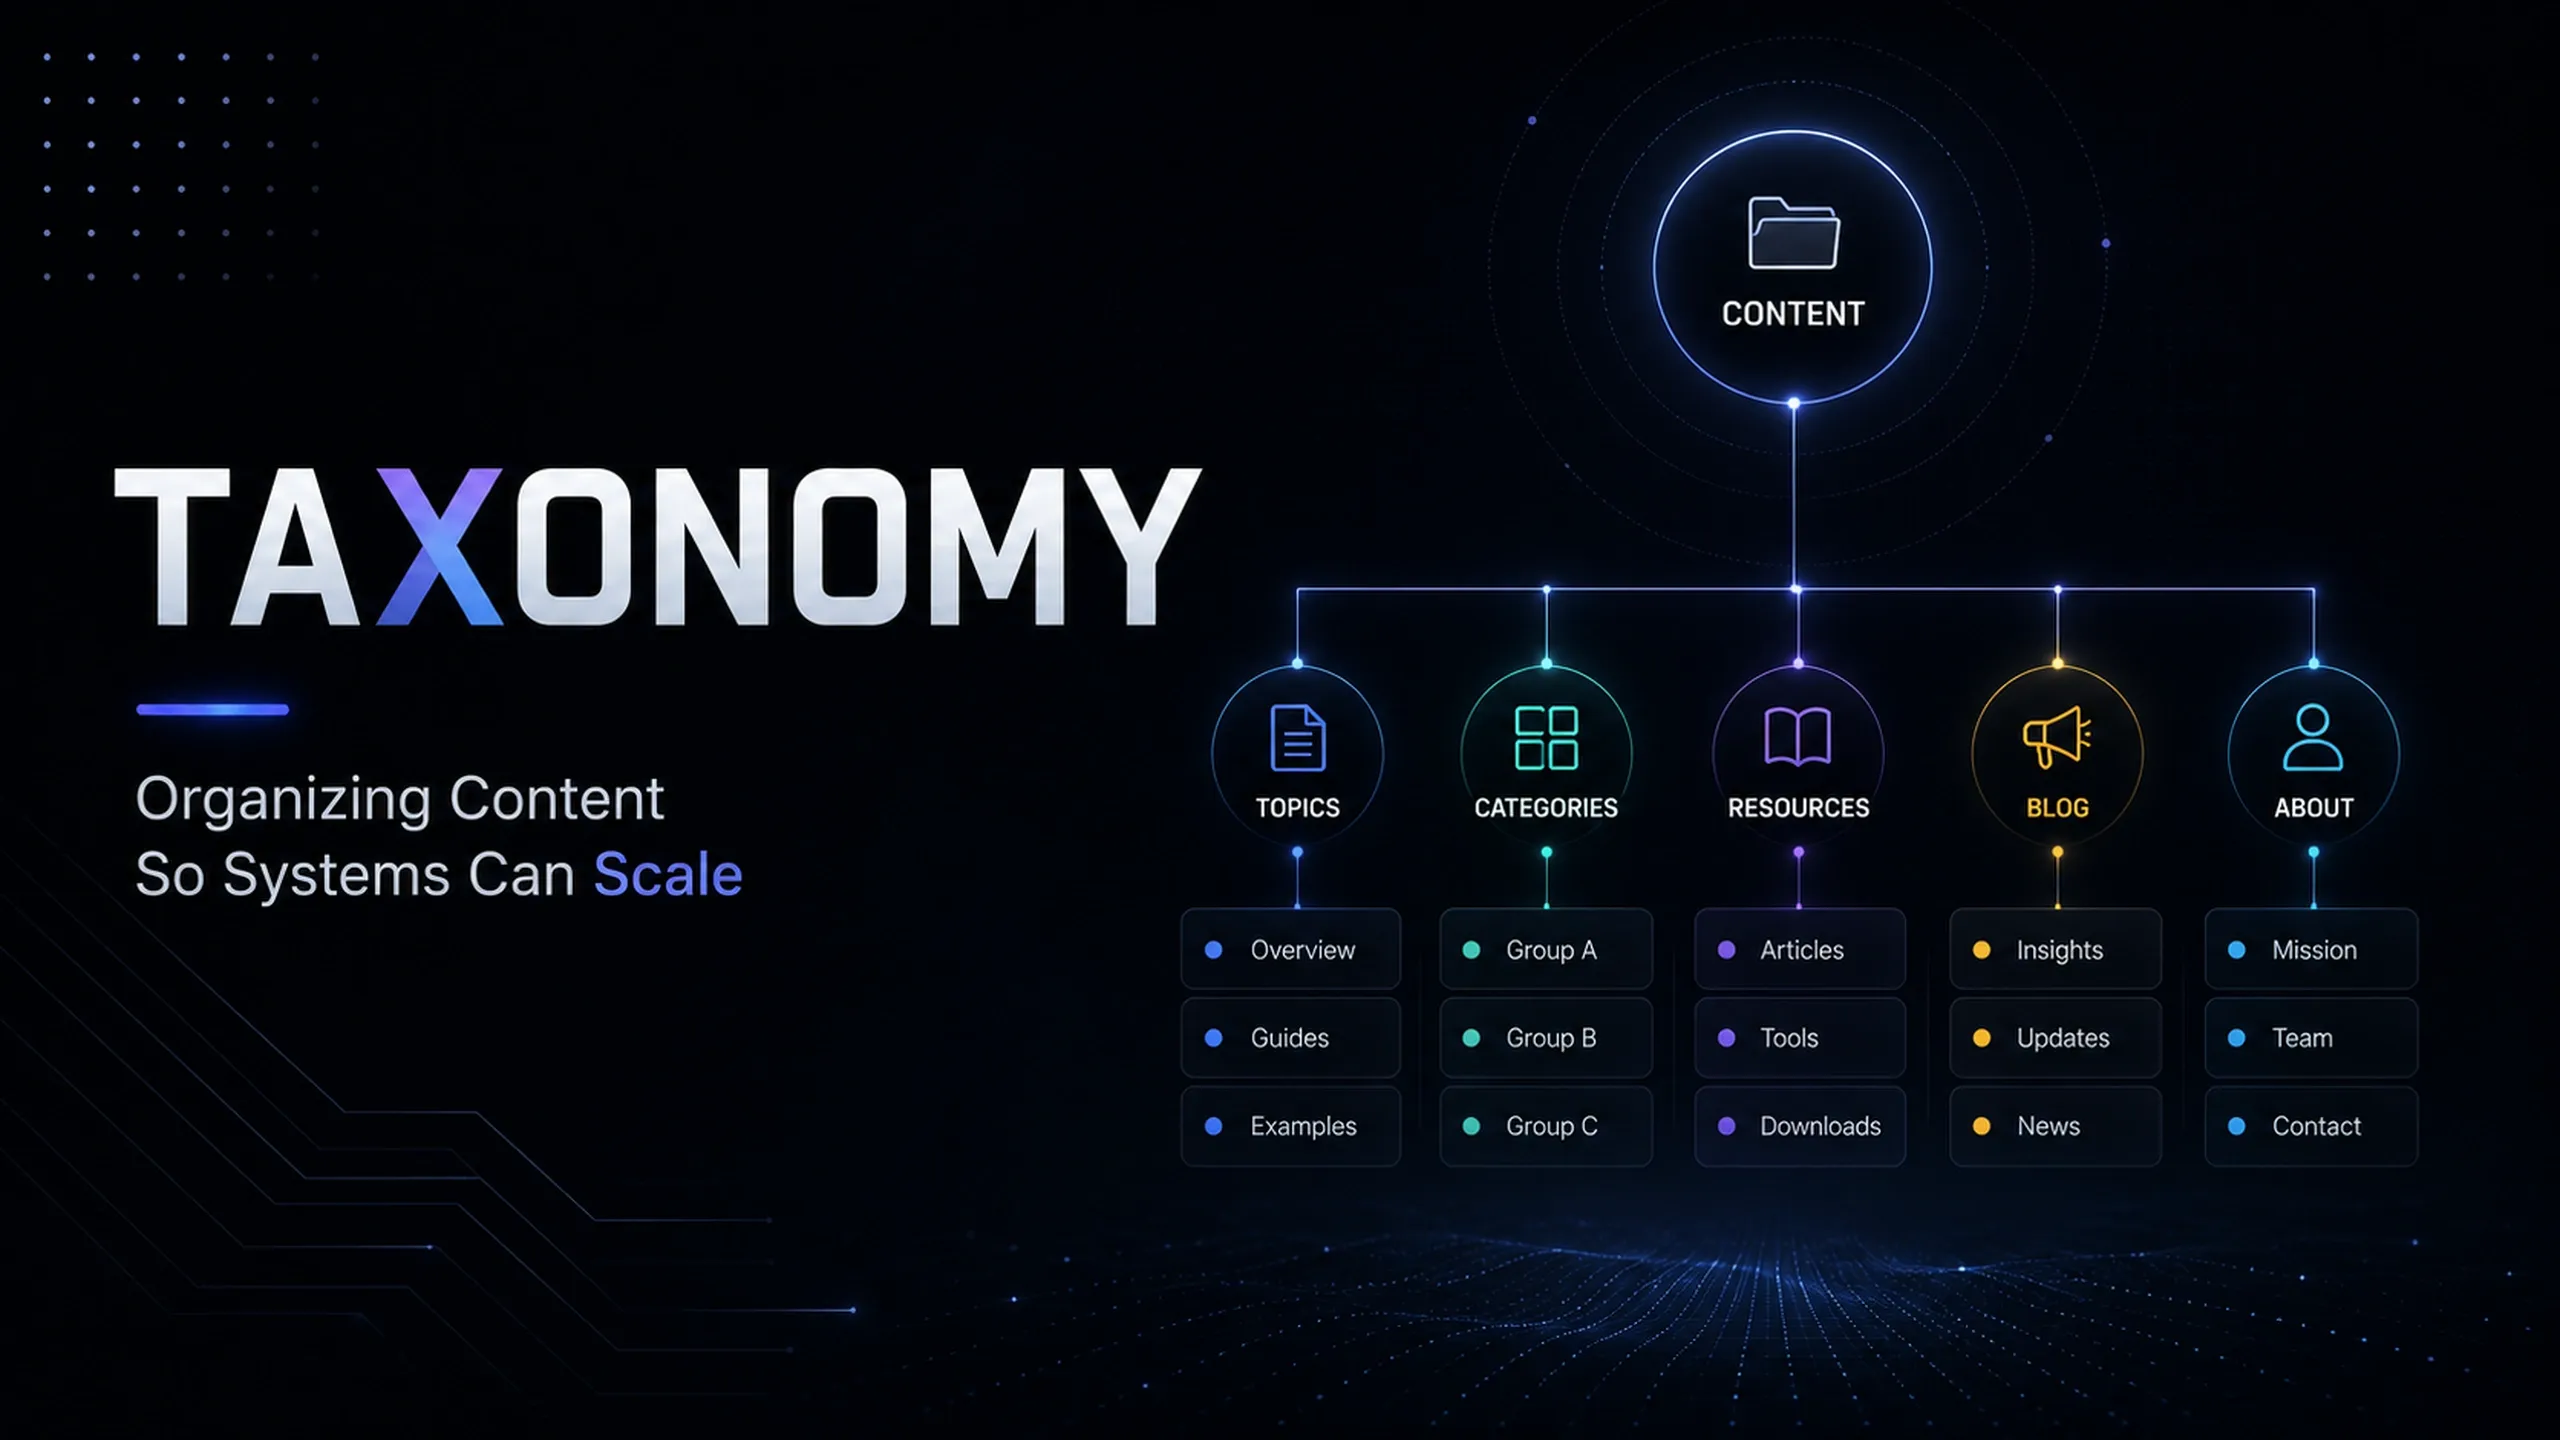
    Learn how taxonomy organizes categories, tags, filters, CMS structure, SEO, internal links, reporting, and governance.

  • Illustration of a website migration process with old and new website structures, server infrastructure, and SEO monitoring elements connected through a migration workflow, representing a search-friendly site transition.
    SEOWebsiteTechnicalStrategy

    Site Migration SEO

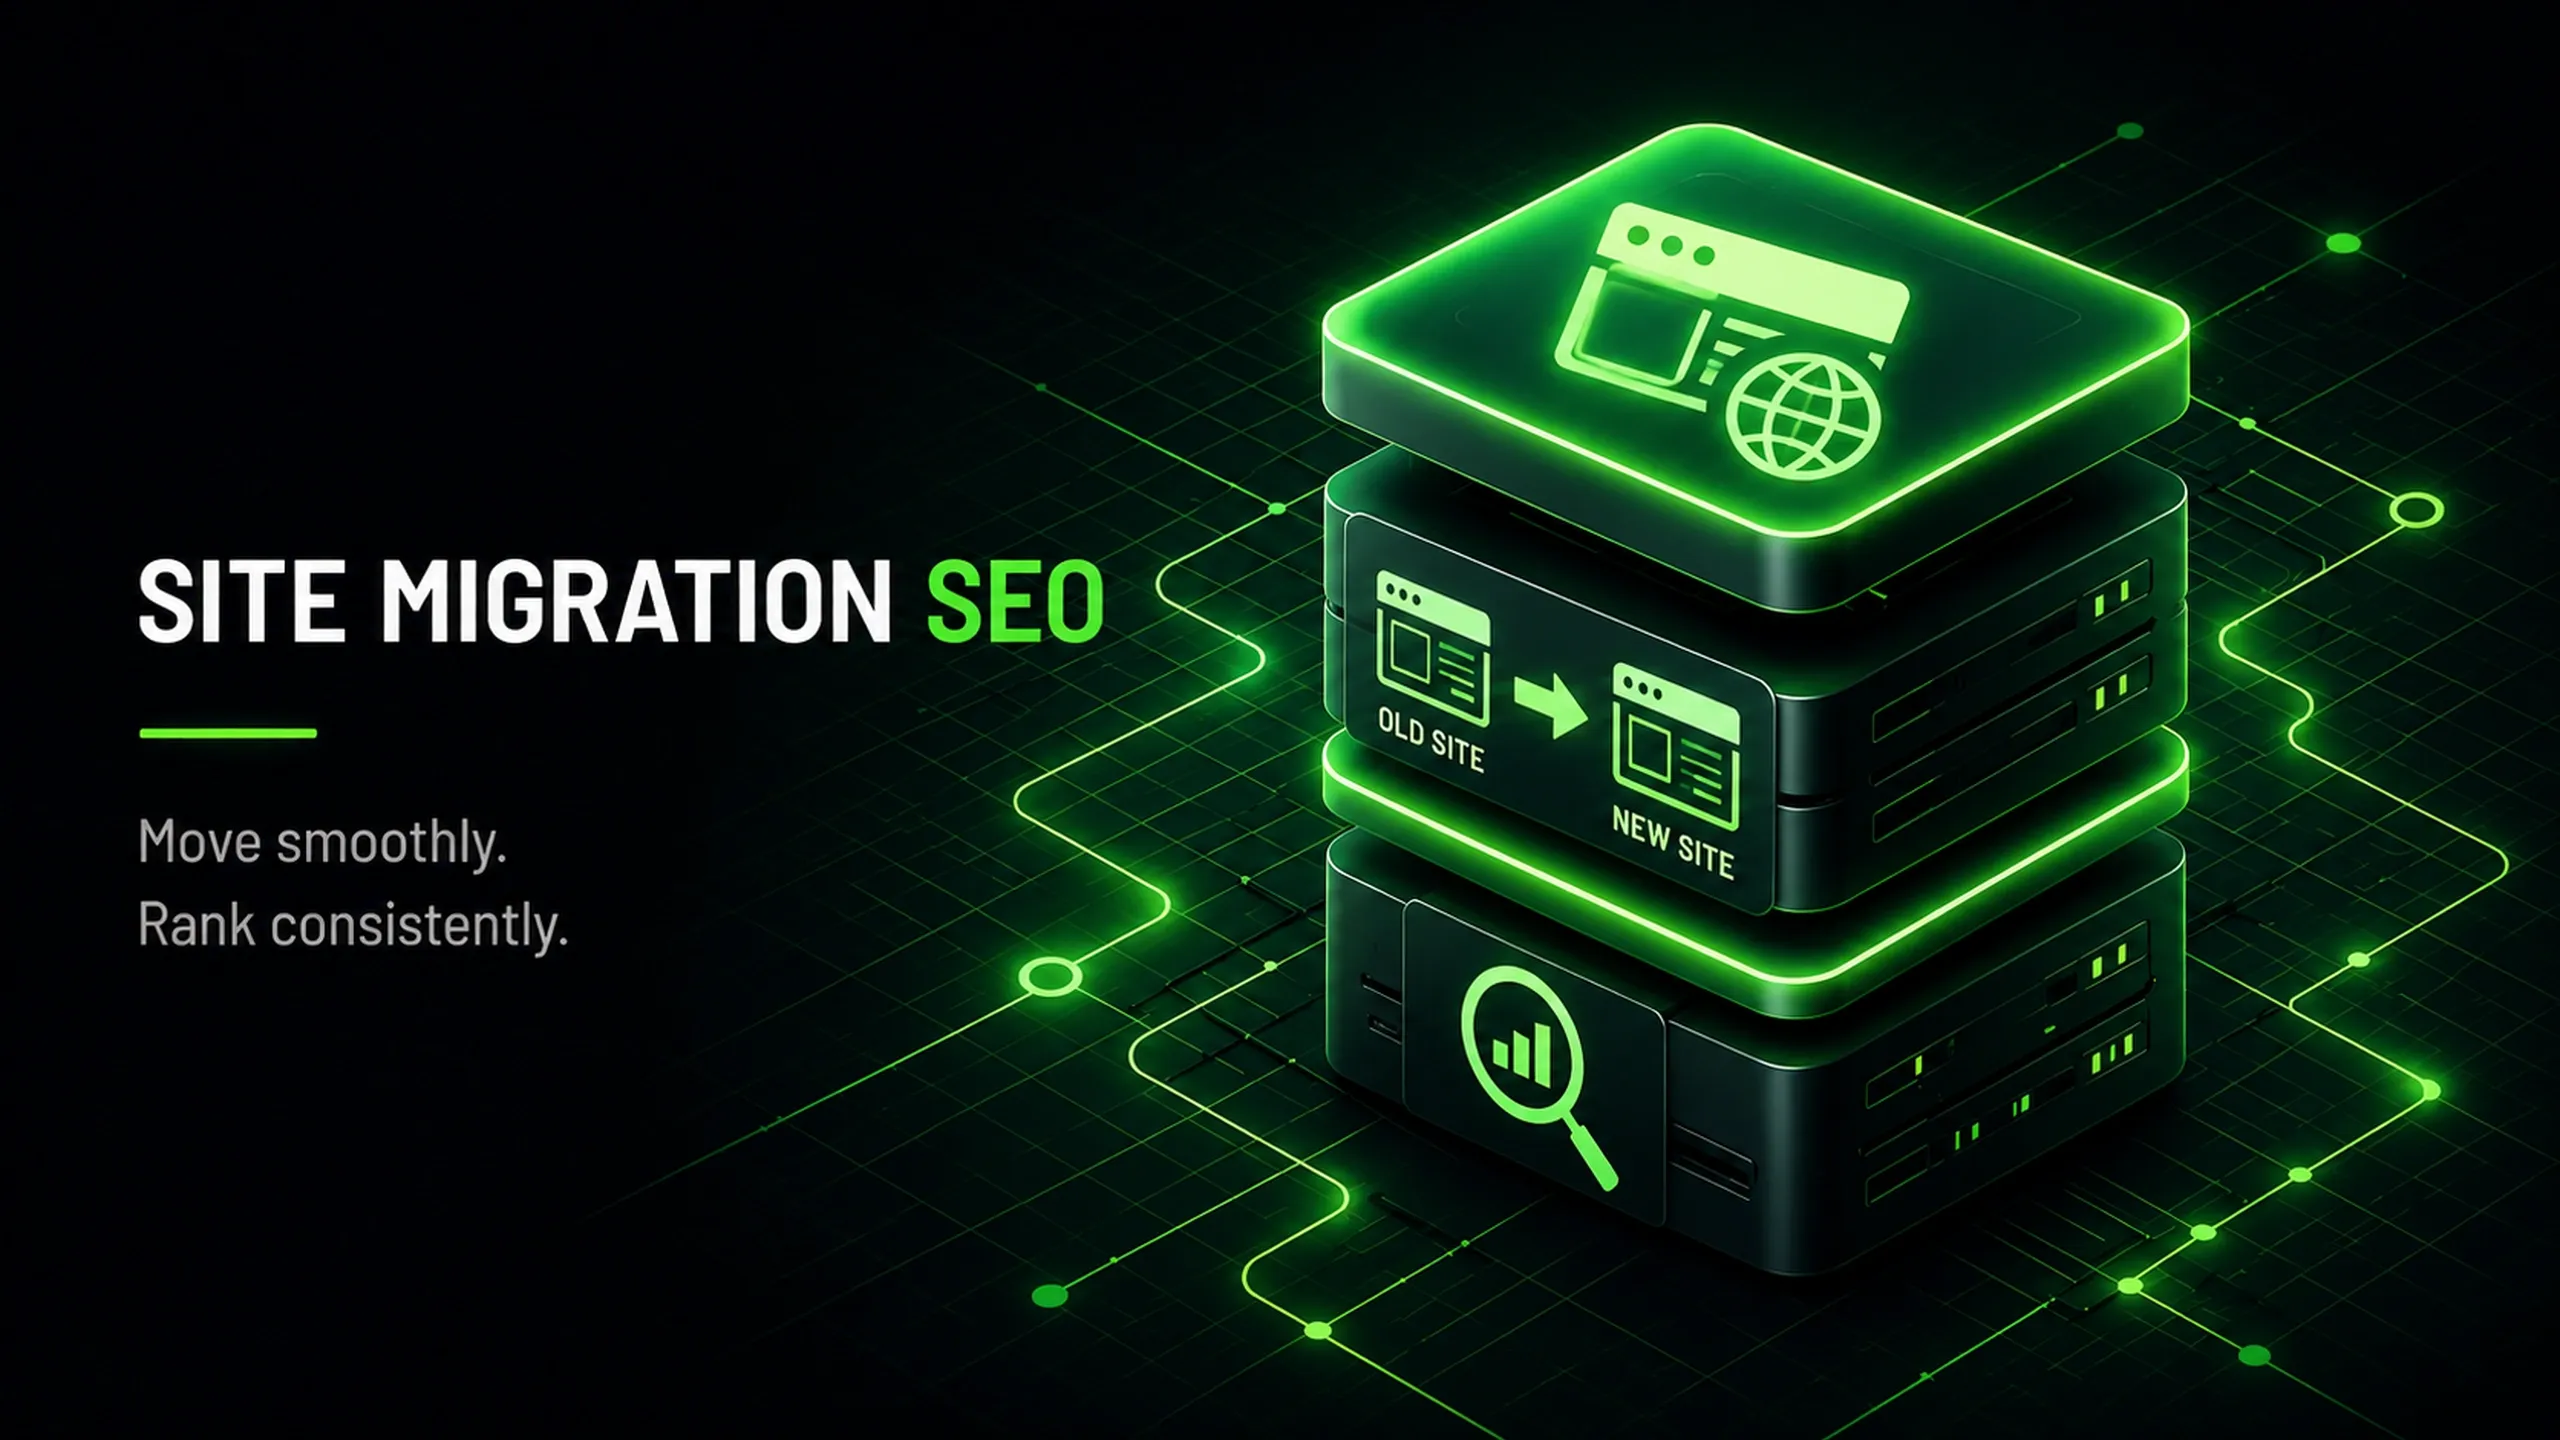
    Learn how site migration SEO protects redirects, crawlability, indexation, content, metadata, analytics, and organic traffic.

  • KPI dashboard visualization showing performance metrics, target achievement, revenue growth, customer satisfaction scores, and an upward trend chart representing business performance measurement and reporting.
    AnalyticsStrategyDataPerformance

    KPIs

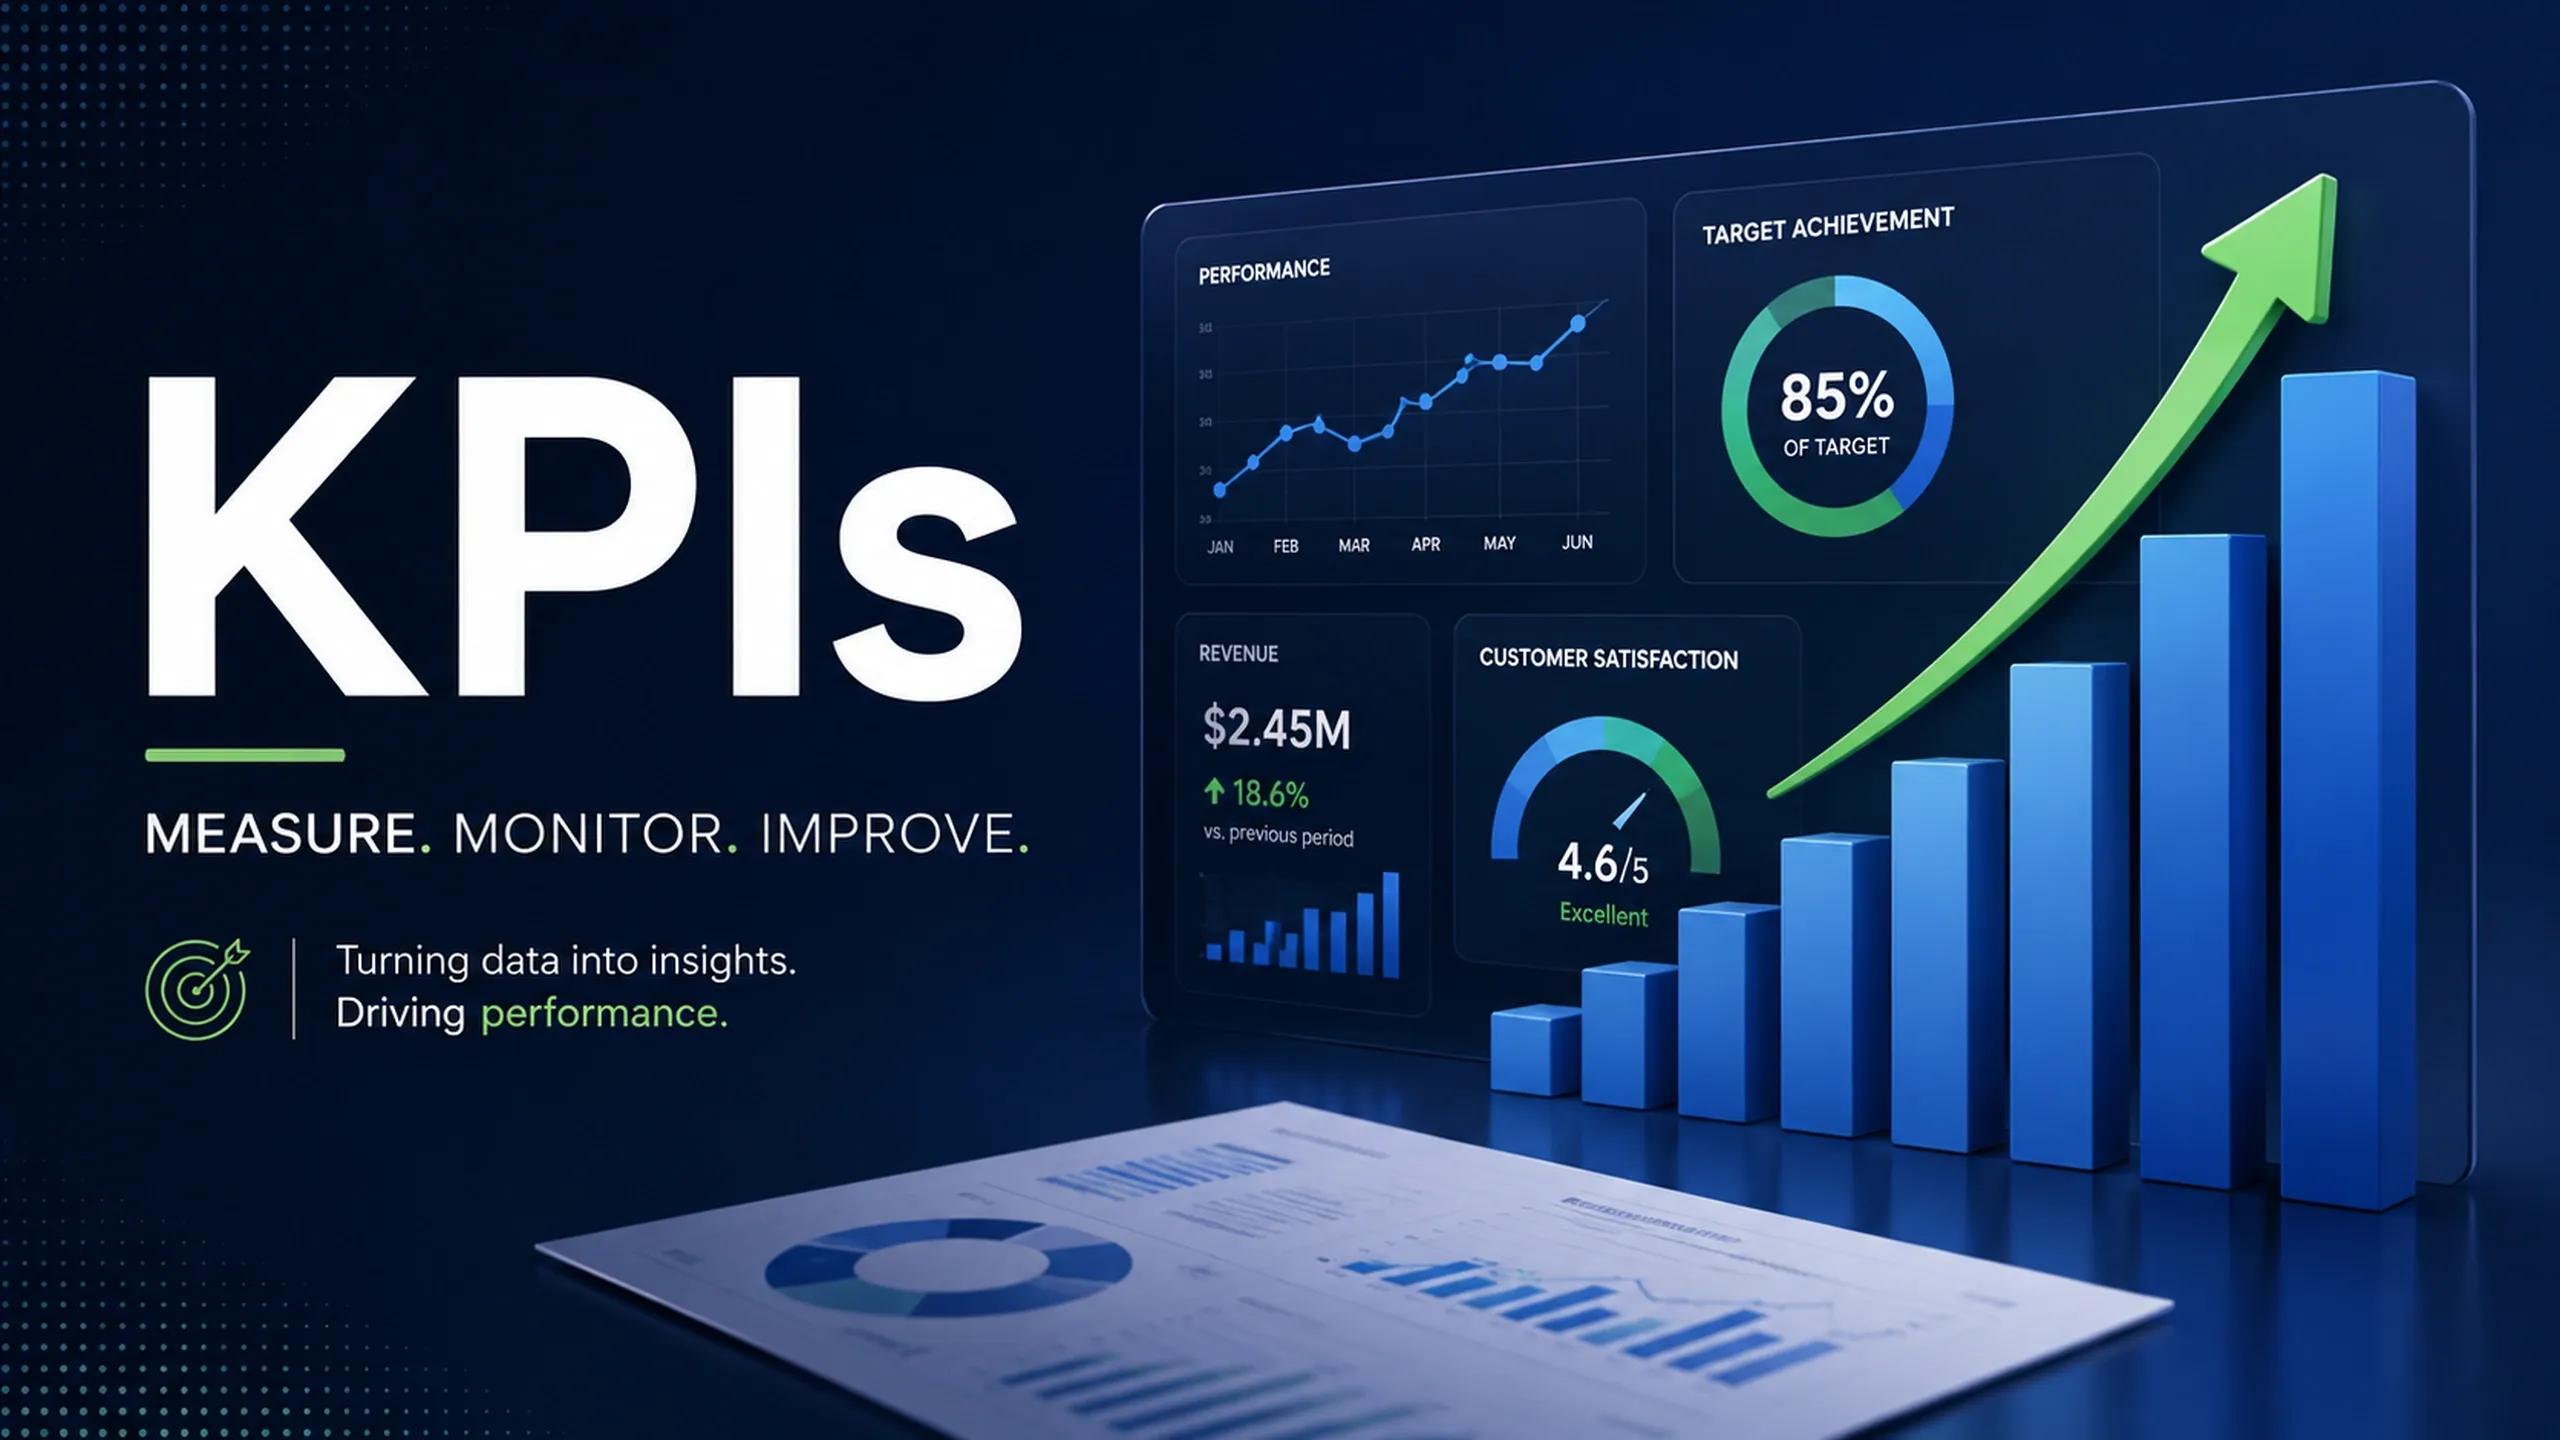
    Learn how KPIs connect objectives, metrics, targets, dashboards, data quality, and decision-making across marketing and operations.

  • Illustration of image SEO optimization showing a website image, alt text panel, image search results, WebP optimization metrics, and image performance indicators connected within a search-focused workflow.
    SEOWebsitePerformance

    Image SEO

    Learn how image SEO improves alt text, file names, compression, responsive images, structured data, sitemaps, accessibility, and CMS workflows.

  • Illustration of a website form interface with fields for name, email, and message, shown inside a modern card layout with a submit button and abstract geometric shapes.
    WebsiteUI/UXAccessibilityConversion

    Forms

    Learn how forms improve UX, accessibility, validation, consent, spam control, CRM workflows, conversion tracking, and reporting.

  • Content modeling diagram showing content types, fields, components, relationships, and taxonomies organized around structured content and distributed across websites, mobile apps, documents, email, IoT, and voice channels.
    ArchitectureContentSystemWebsite

    Content Modeling

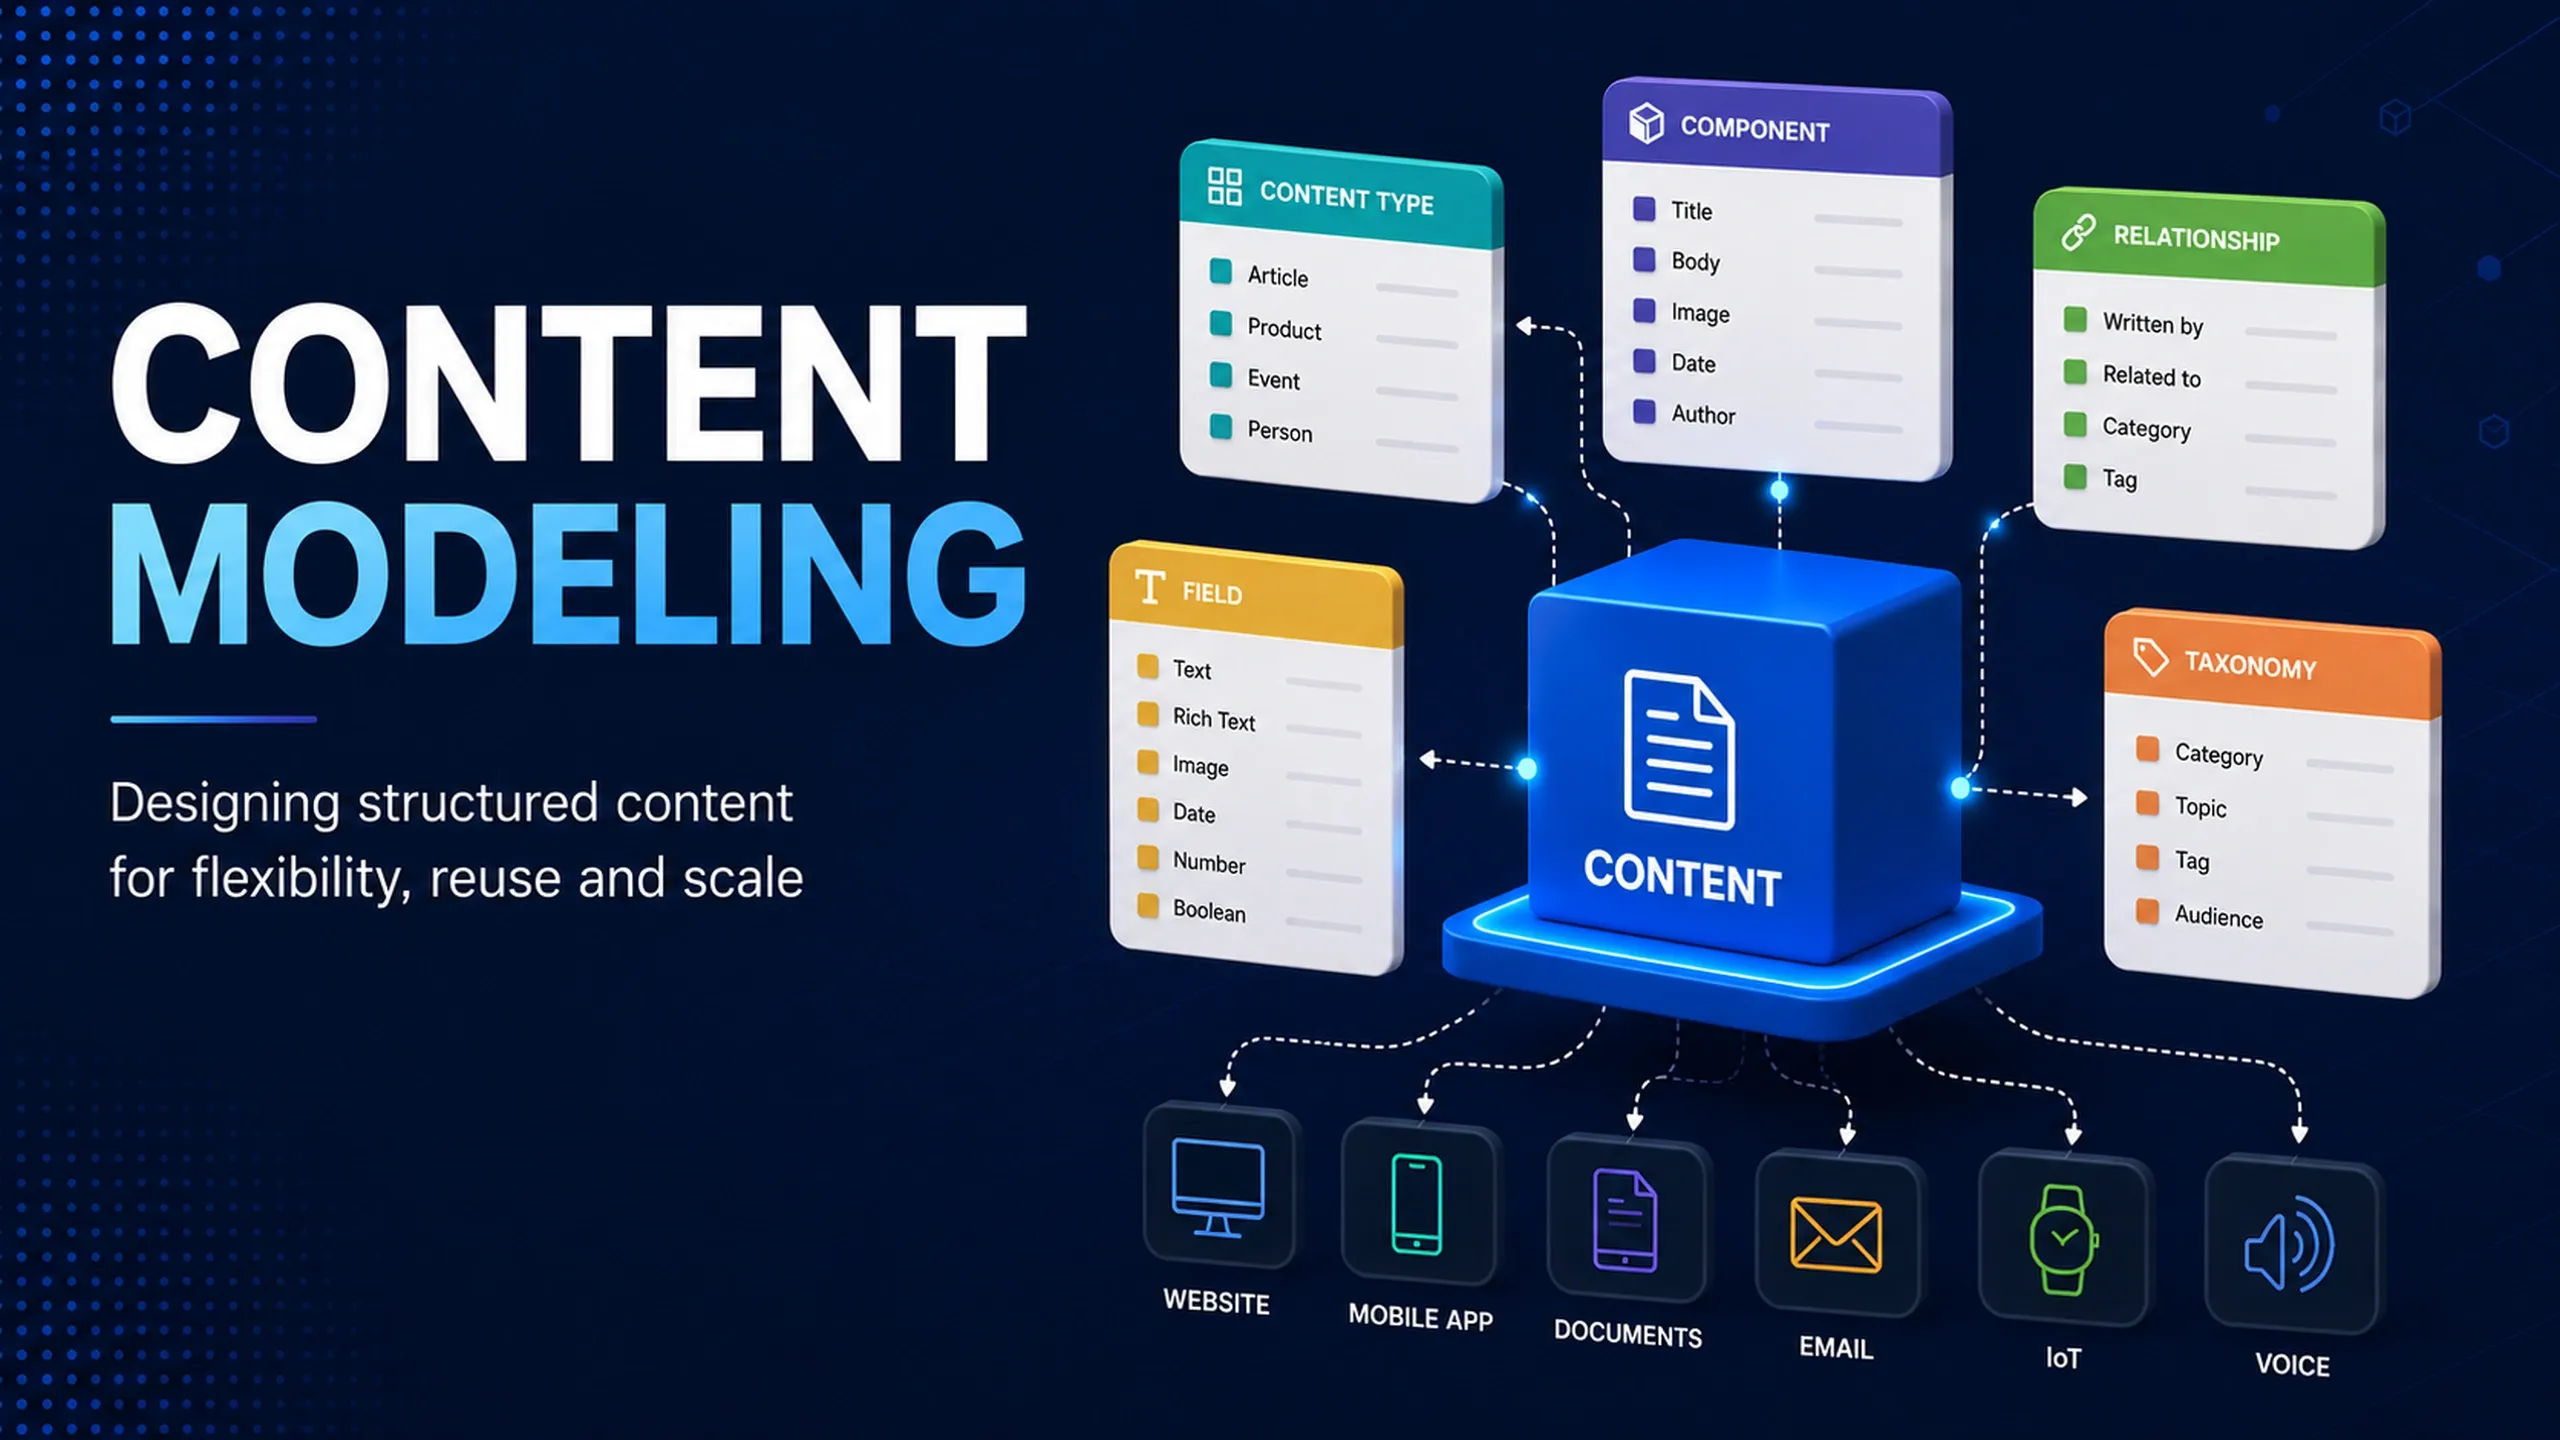
    Learn how content modeling structures fields, content types, CMS blocks, metadata, relationships, SEO, and reusable content.

  • Data migration illustration showing source databases, files, applications, cloud services, and streams moving into a new data system for analytics, AI, security, and performance.
    DataSystemTechnicalIntegration

    Data Migration

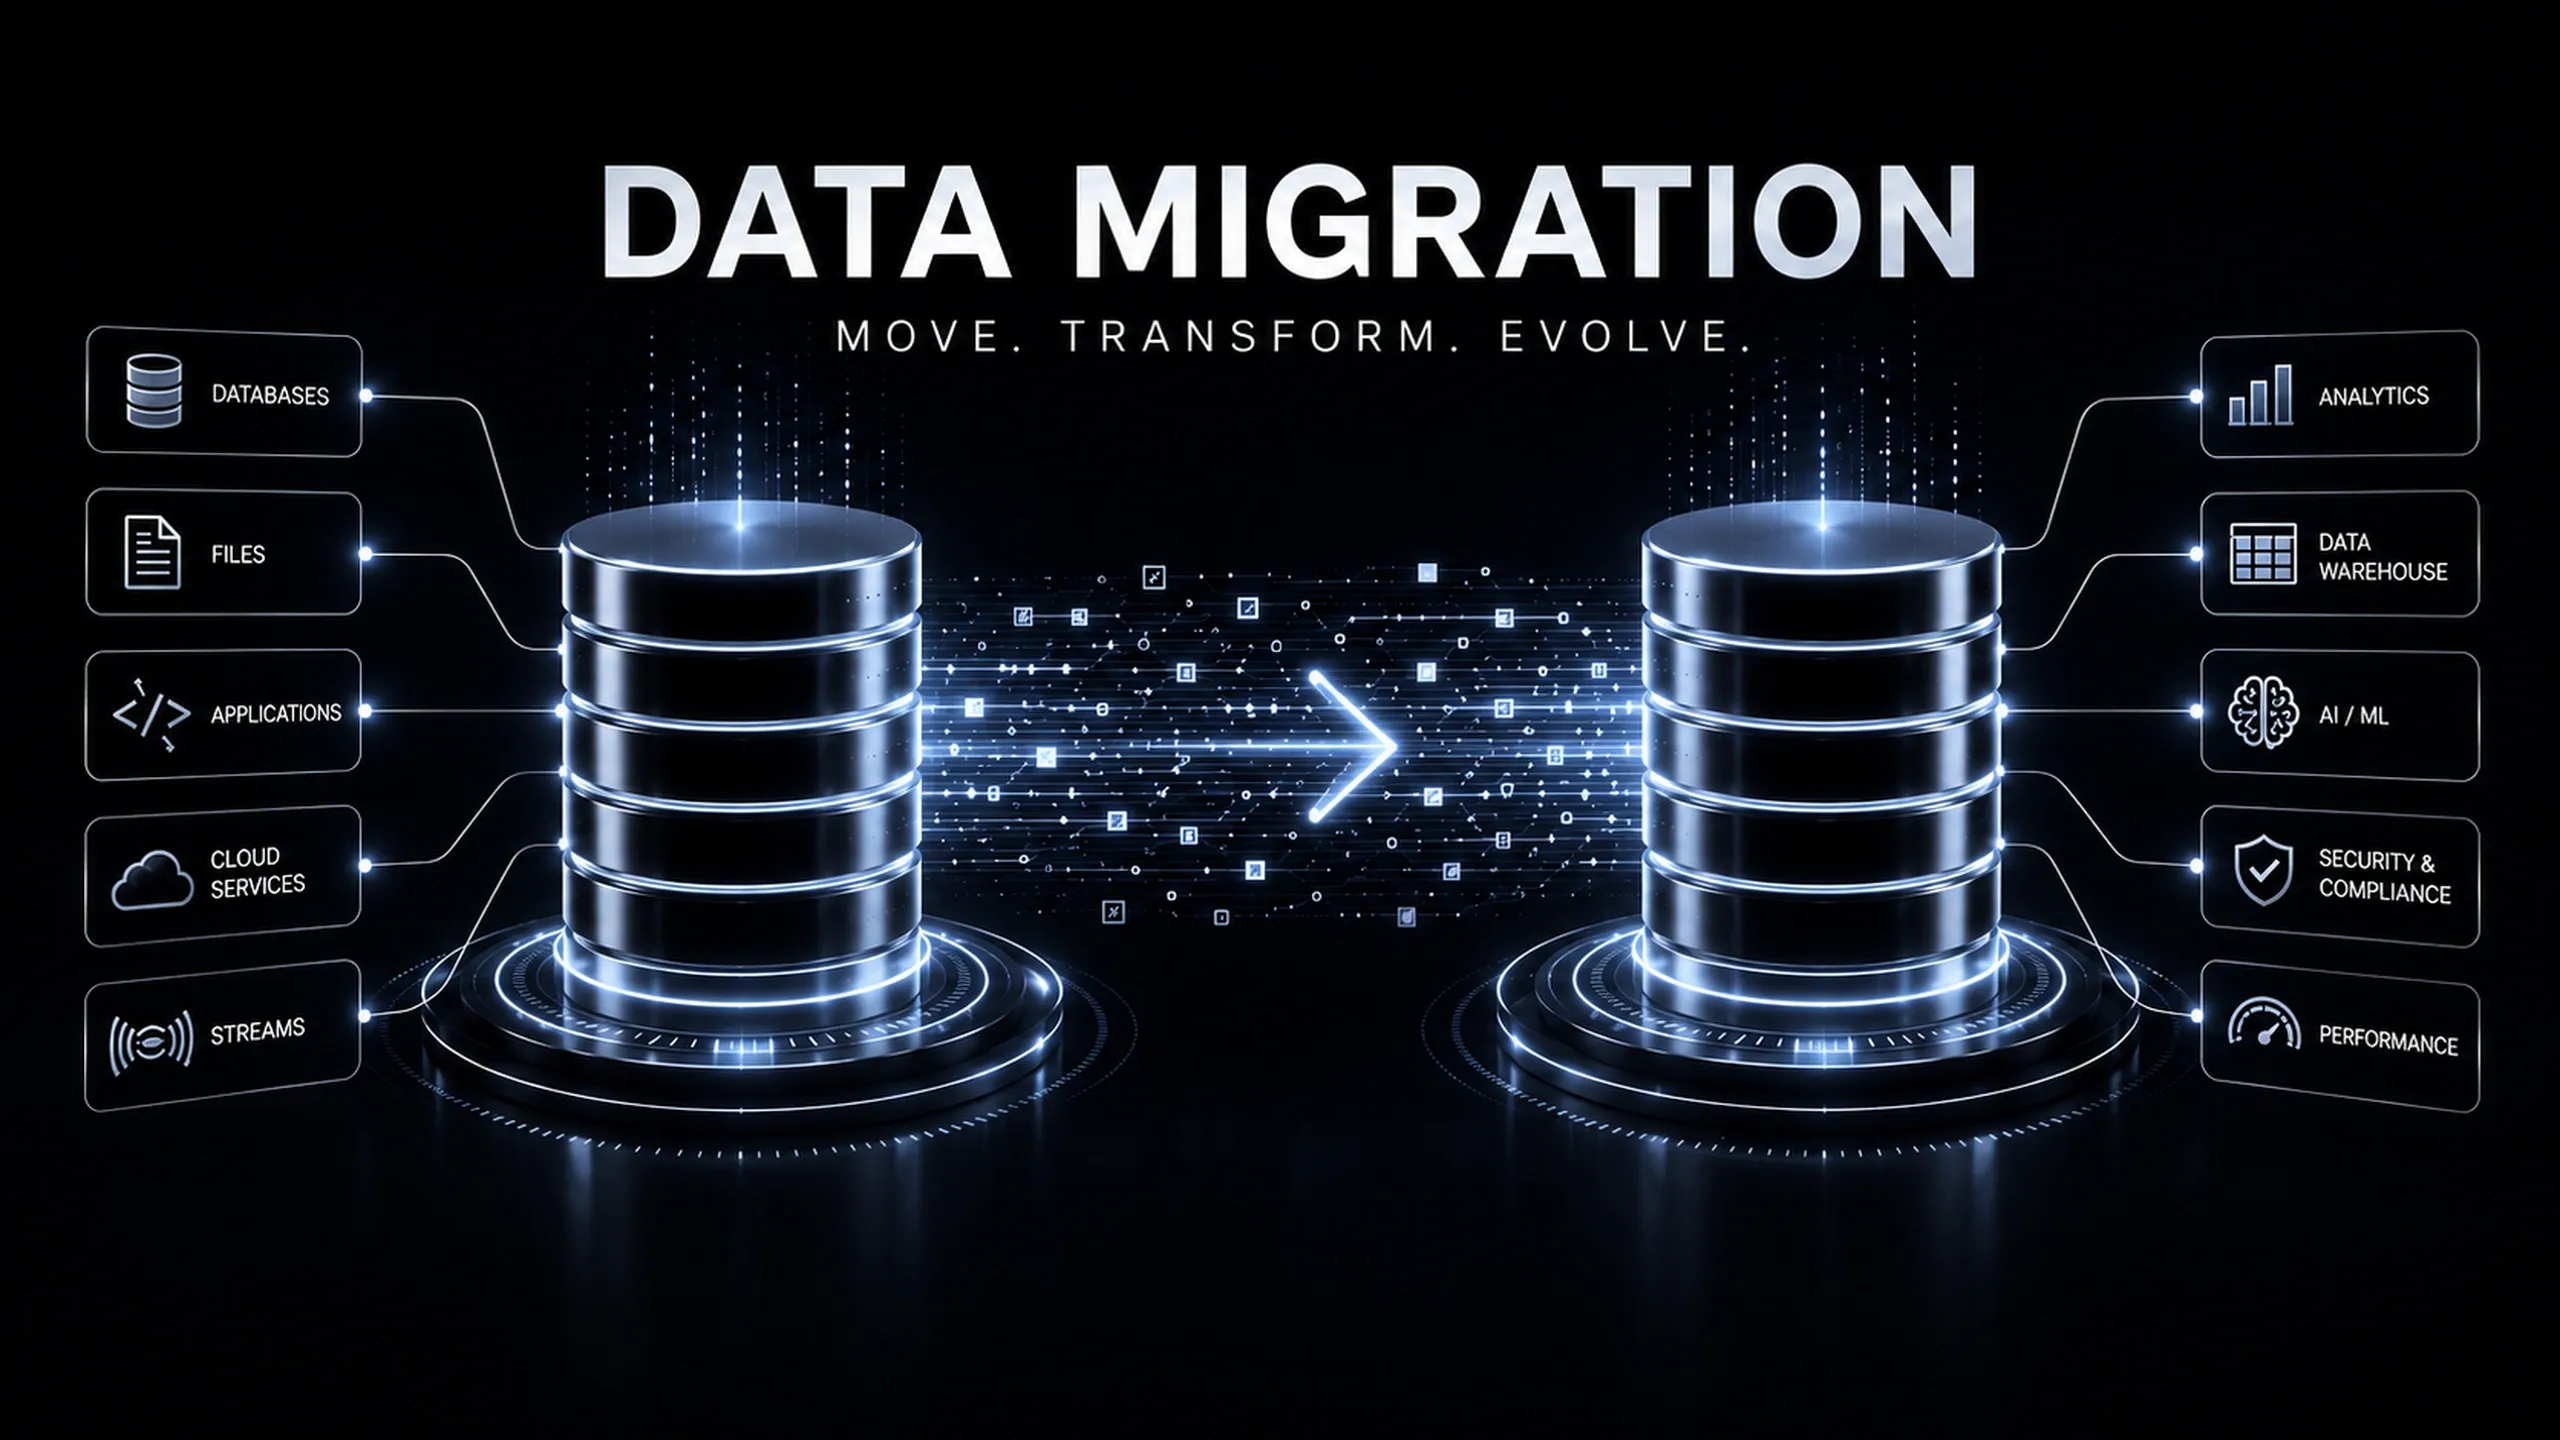
    Learn how data migration protects source-of-truth clarity, field mapping, data quality, validation, integrations, and reporting.

  • Abstract attribution visualization featuring intersecting infinity-shaped signal paths and waveform patterns flowing across a horizontal axis. Blue, purple, and orange data streams converge at a central point, symbolizing the interaction of multiple marketing touchpoints, customer journeys, and attribution models used to assign conversion credit across channels.
    AnalyticsDataAdvertisingStrategy

    Attribution

    Understand how attribution connects GA4, UTMs, ads, SEO analytics, conversion tracking, reporting, and better decisions.

  • Featured image for Prompt Engineering showing a ChatGPT-style conversation interface containing a structured prompt template with placeholders for role, task, context, audience, goal, constraints, format, examples, and review criteria. The interface appears on a dark futuristic background with subtle digital wave patterns and cyan neon highlights.
    AIContentAutomationStrategy

    Prompt Engineering

    Learn how prompt engineering improves AI outputs through clearer tasks, context, constraints, examples, and review.

  • Visualization of a webhook event trigger sending real-time notifications from a source application to multiple connected systems, services, and databases whenever an event occurs.
    IntegrationAutomationTechnicalSystem

    Webhooks

    Learn how webhooks send event notifications, validate payloads, handle retries, and keep system workflows reliable.

  • Illustration of a middleware layer positioned between multiple systems, databases, cloud services, applications, and users, acting as a central integration hub that coordinates communication and data exchange.
    IntegrationSystemTechnicalAutomation

    Middleware

    Learn how middleware routes, transforms, validates, monitors, and governs data flow between connected systems and workflows.