SEOContentWebsiteAccessibility
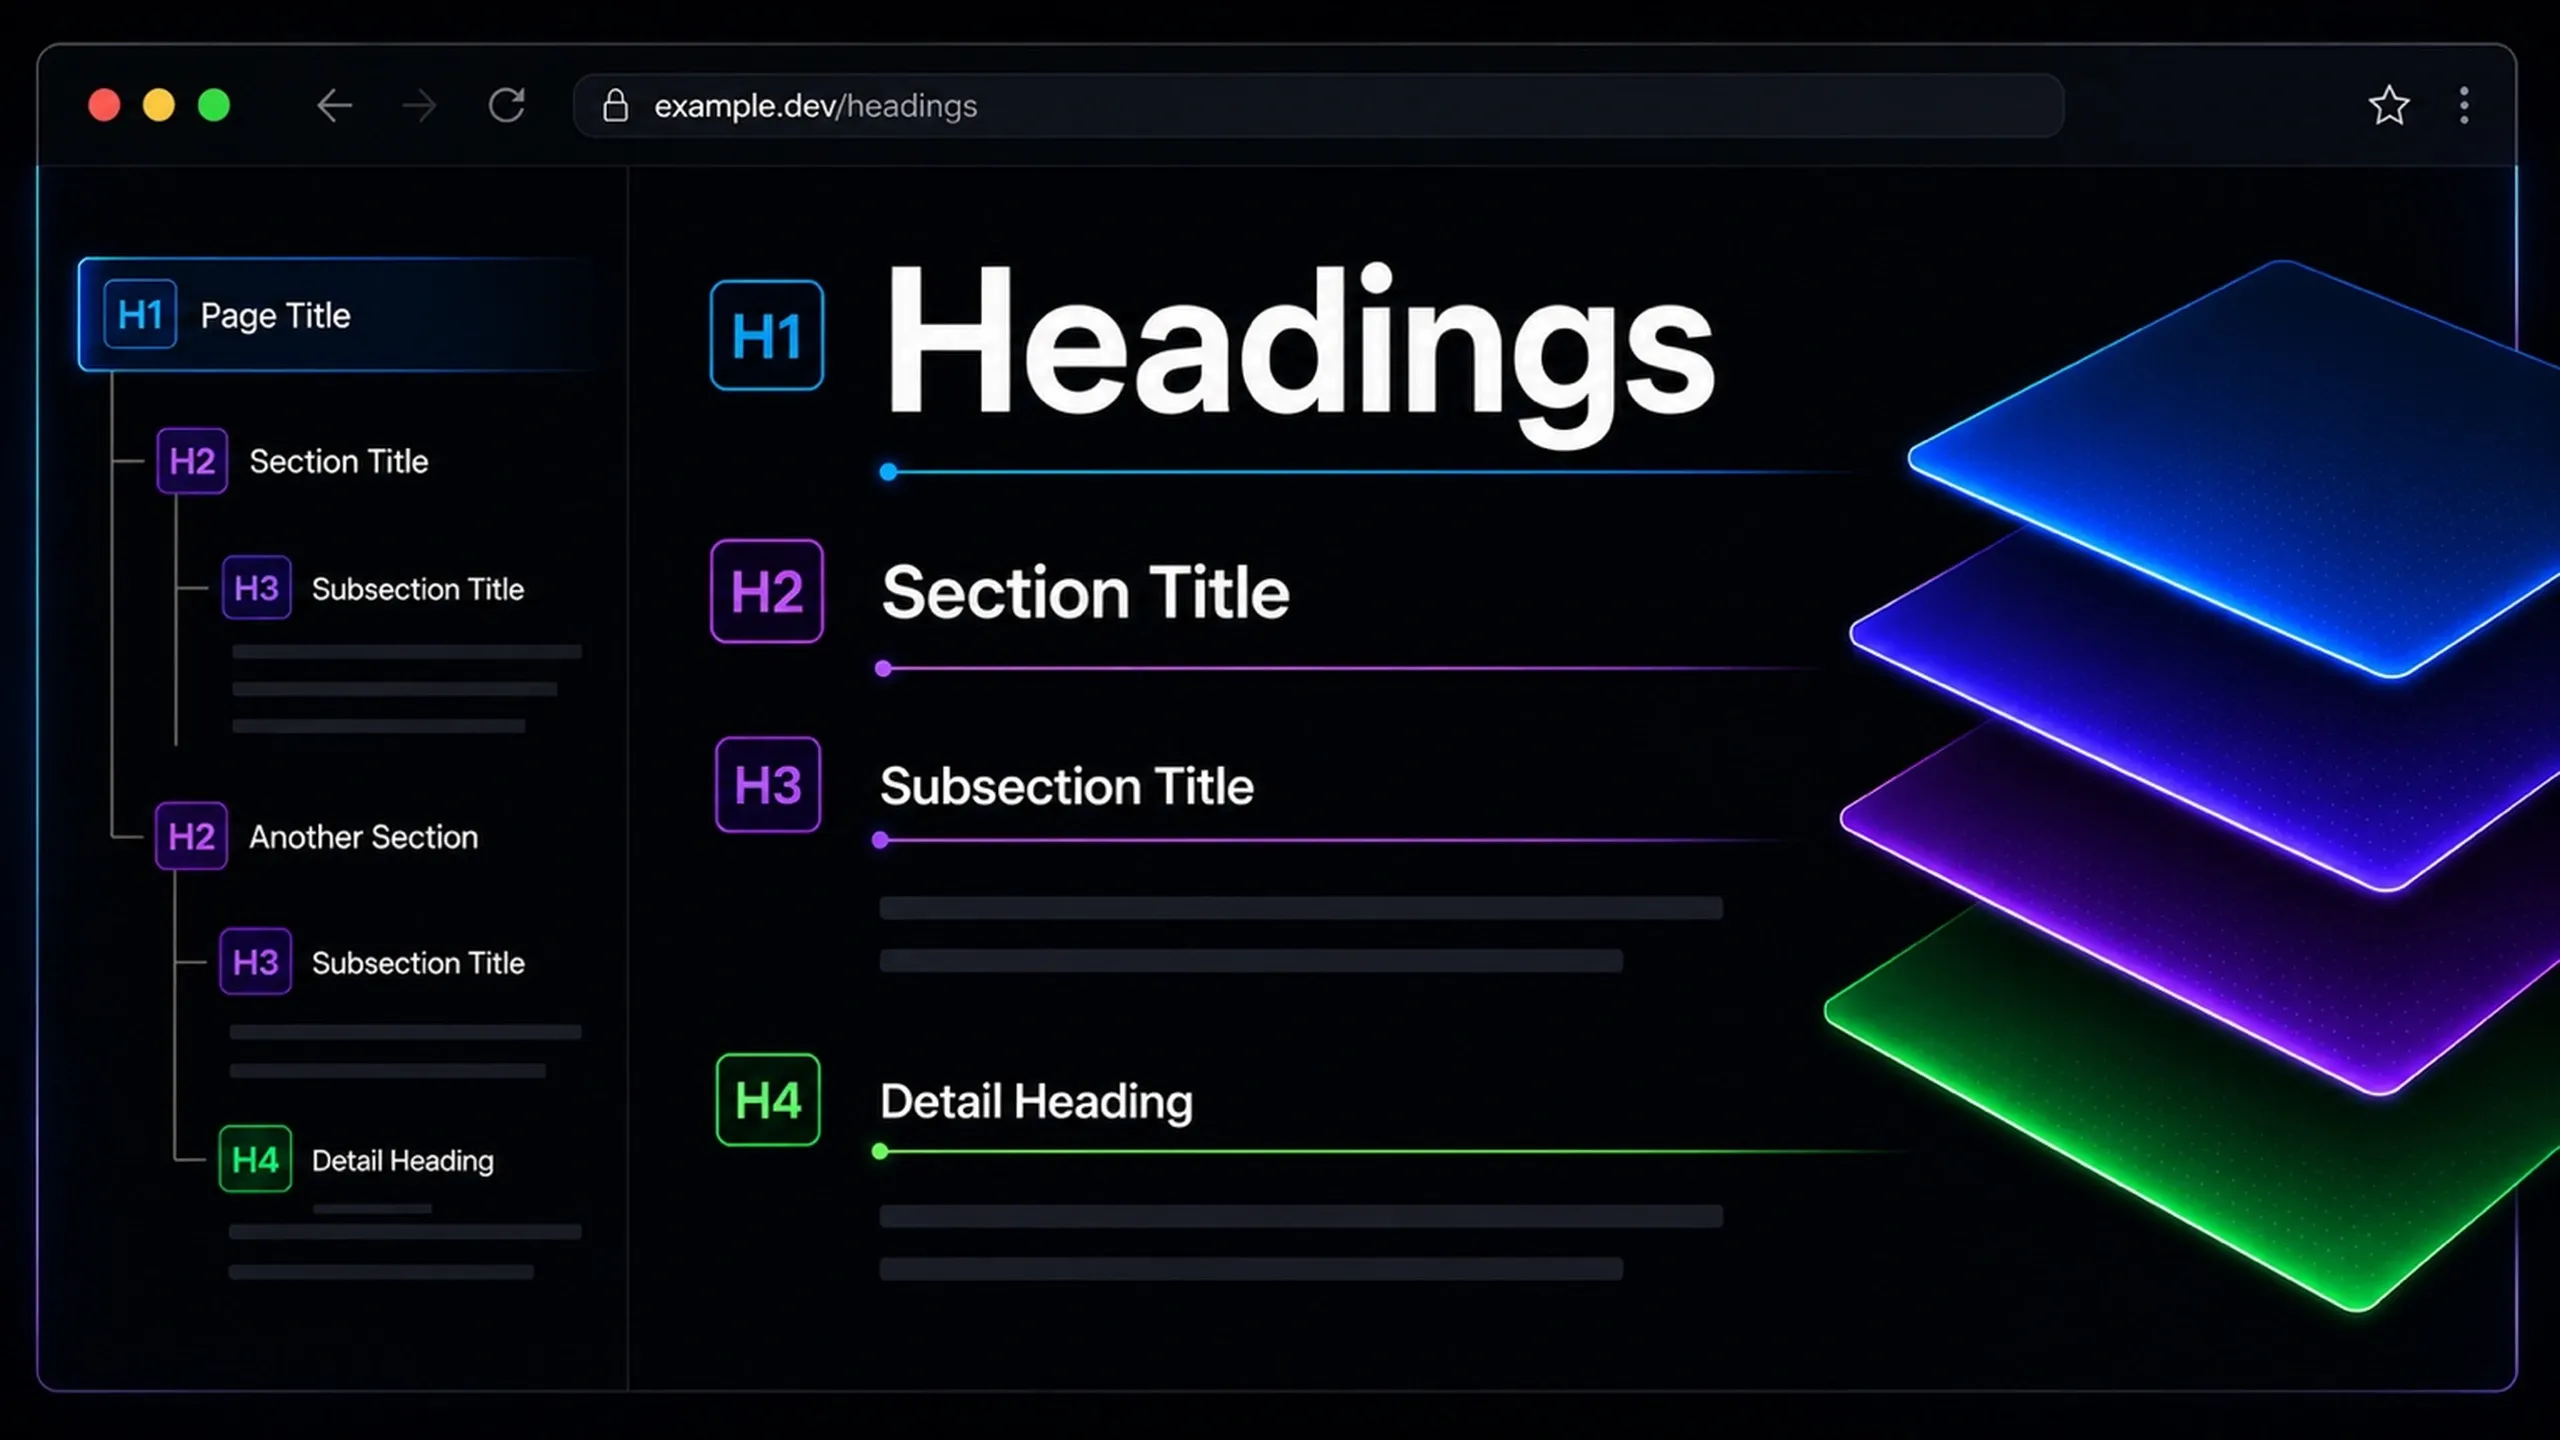
Headings
Learn how headings improve page structure, readability, SEO, accessibility, and content clarity across websites.
Learn how headings improve page structure, readability, SEO, accessibility, and content clarity across websites.
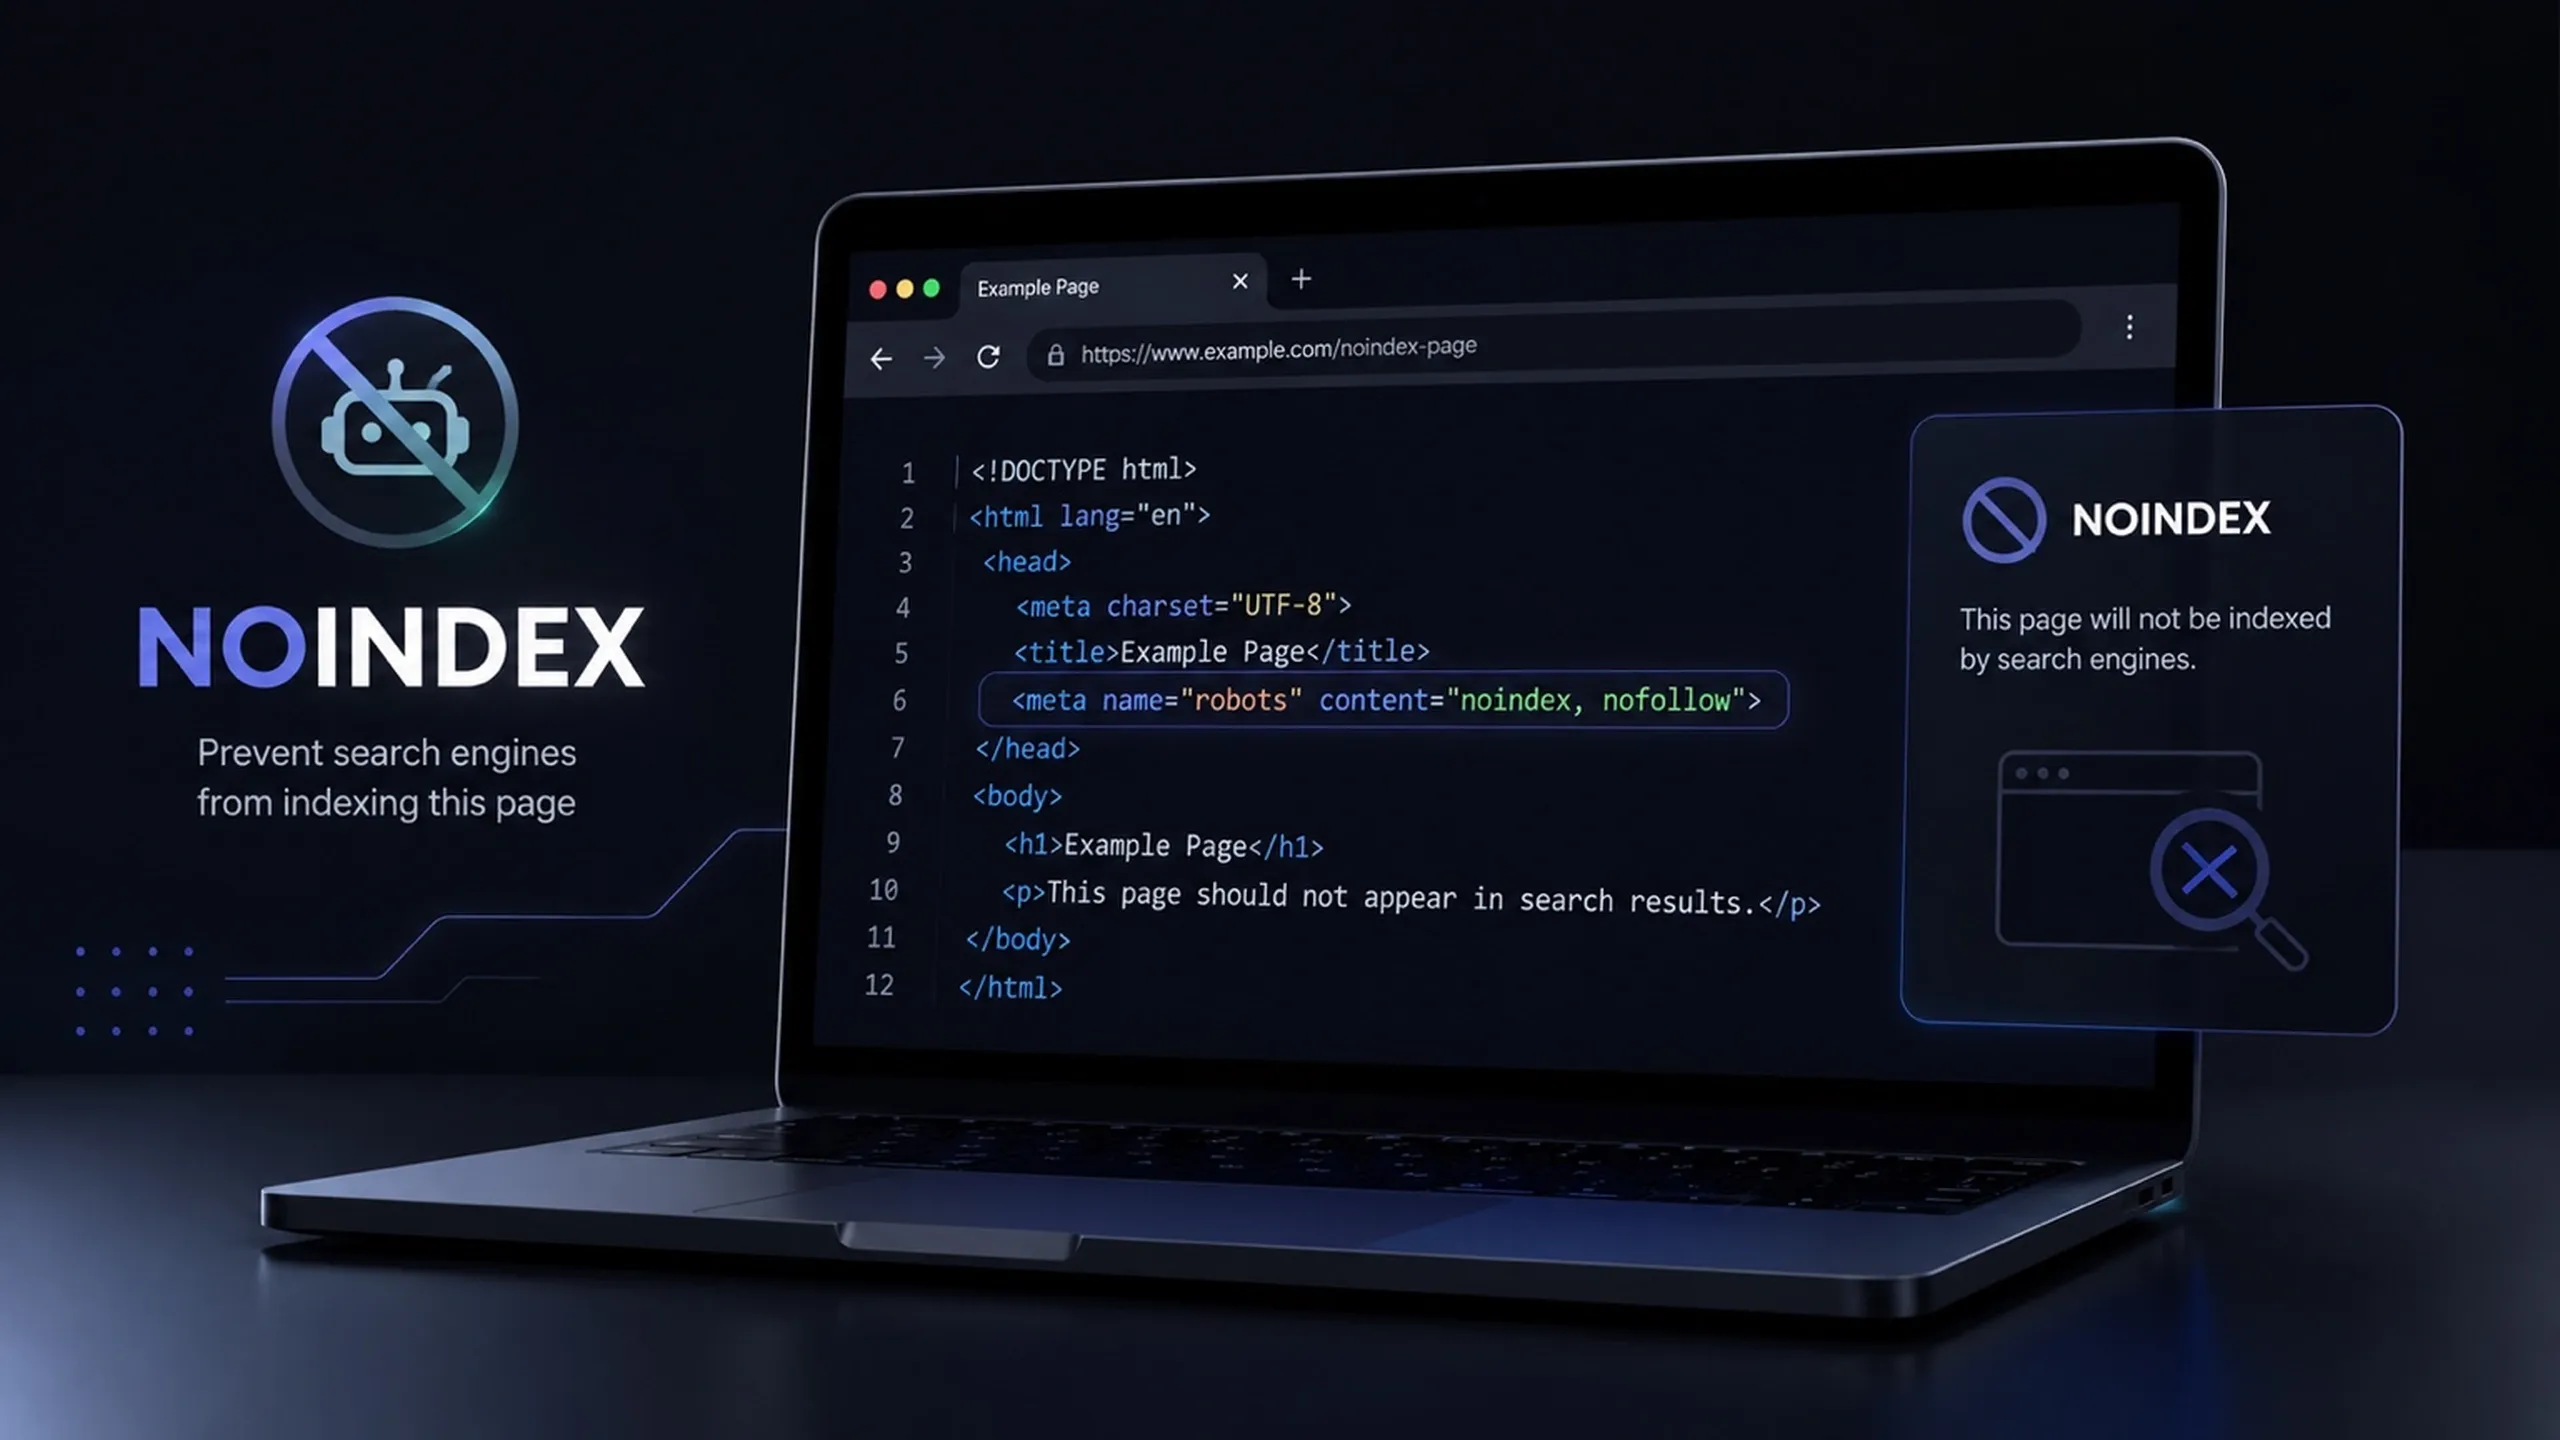
Learn what noindex means, when to use it, and how to keep the right pages out of search results without hurting SEO.

Learn how marketing strategy connects objectives, audiences, positioning, channels, budgets, growth, competition, and measurement.

Learn how lead scoring systems connect data, rules, thresholds, workflows, routing, and ownership to turn lead quality into action.

Learn what lead scoring is, how it ranks leads, and how fit, intent, engagement, and negative signals improve prioritization.

Learn what leads are, how lead generation works, and how businesses qualify, manage, and convert leads effectively.

Learn how strong page architecture improves blog posts, product pages, service pages, landing pages, and user experience.
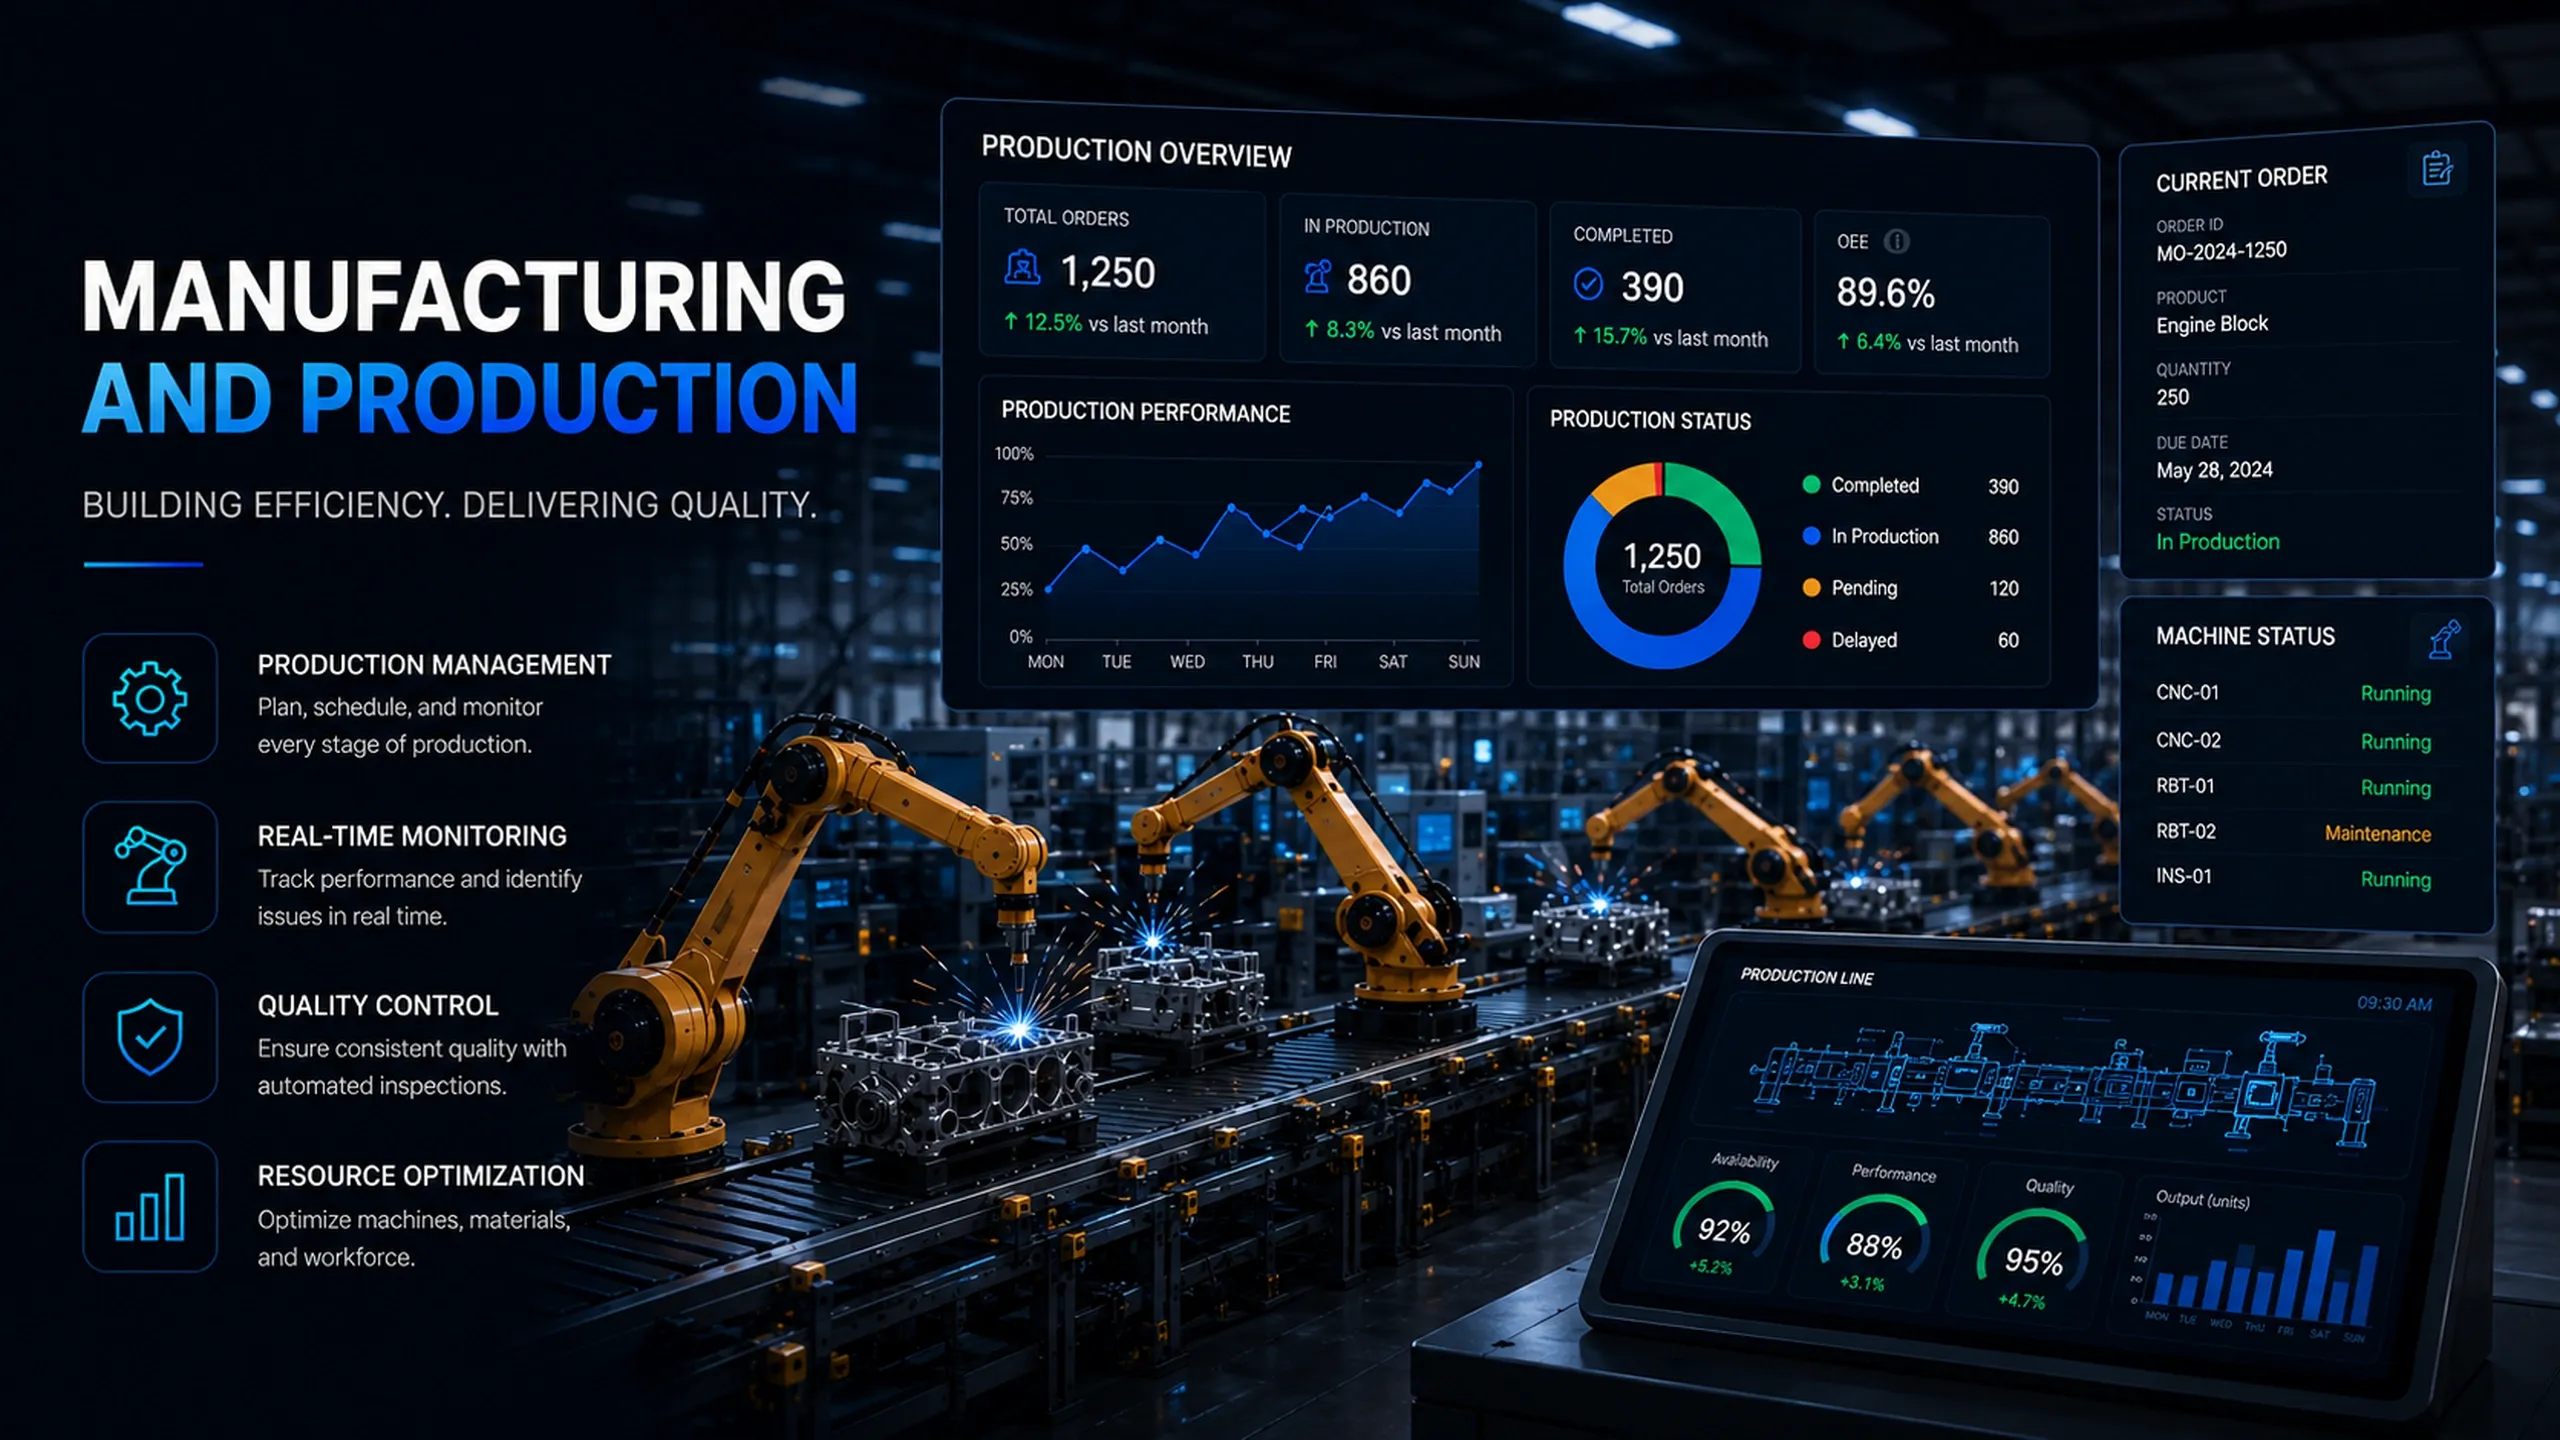
Learn how manufacturing and production affect inventory, from raw materials and WIP to finished goods, quality control, and planning.

Learn how lazy loading improves website speed, performance, UX, and SEO by delaying non-critical resources until needed.
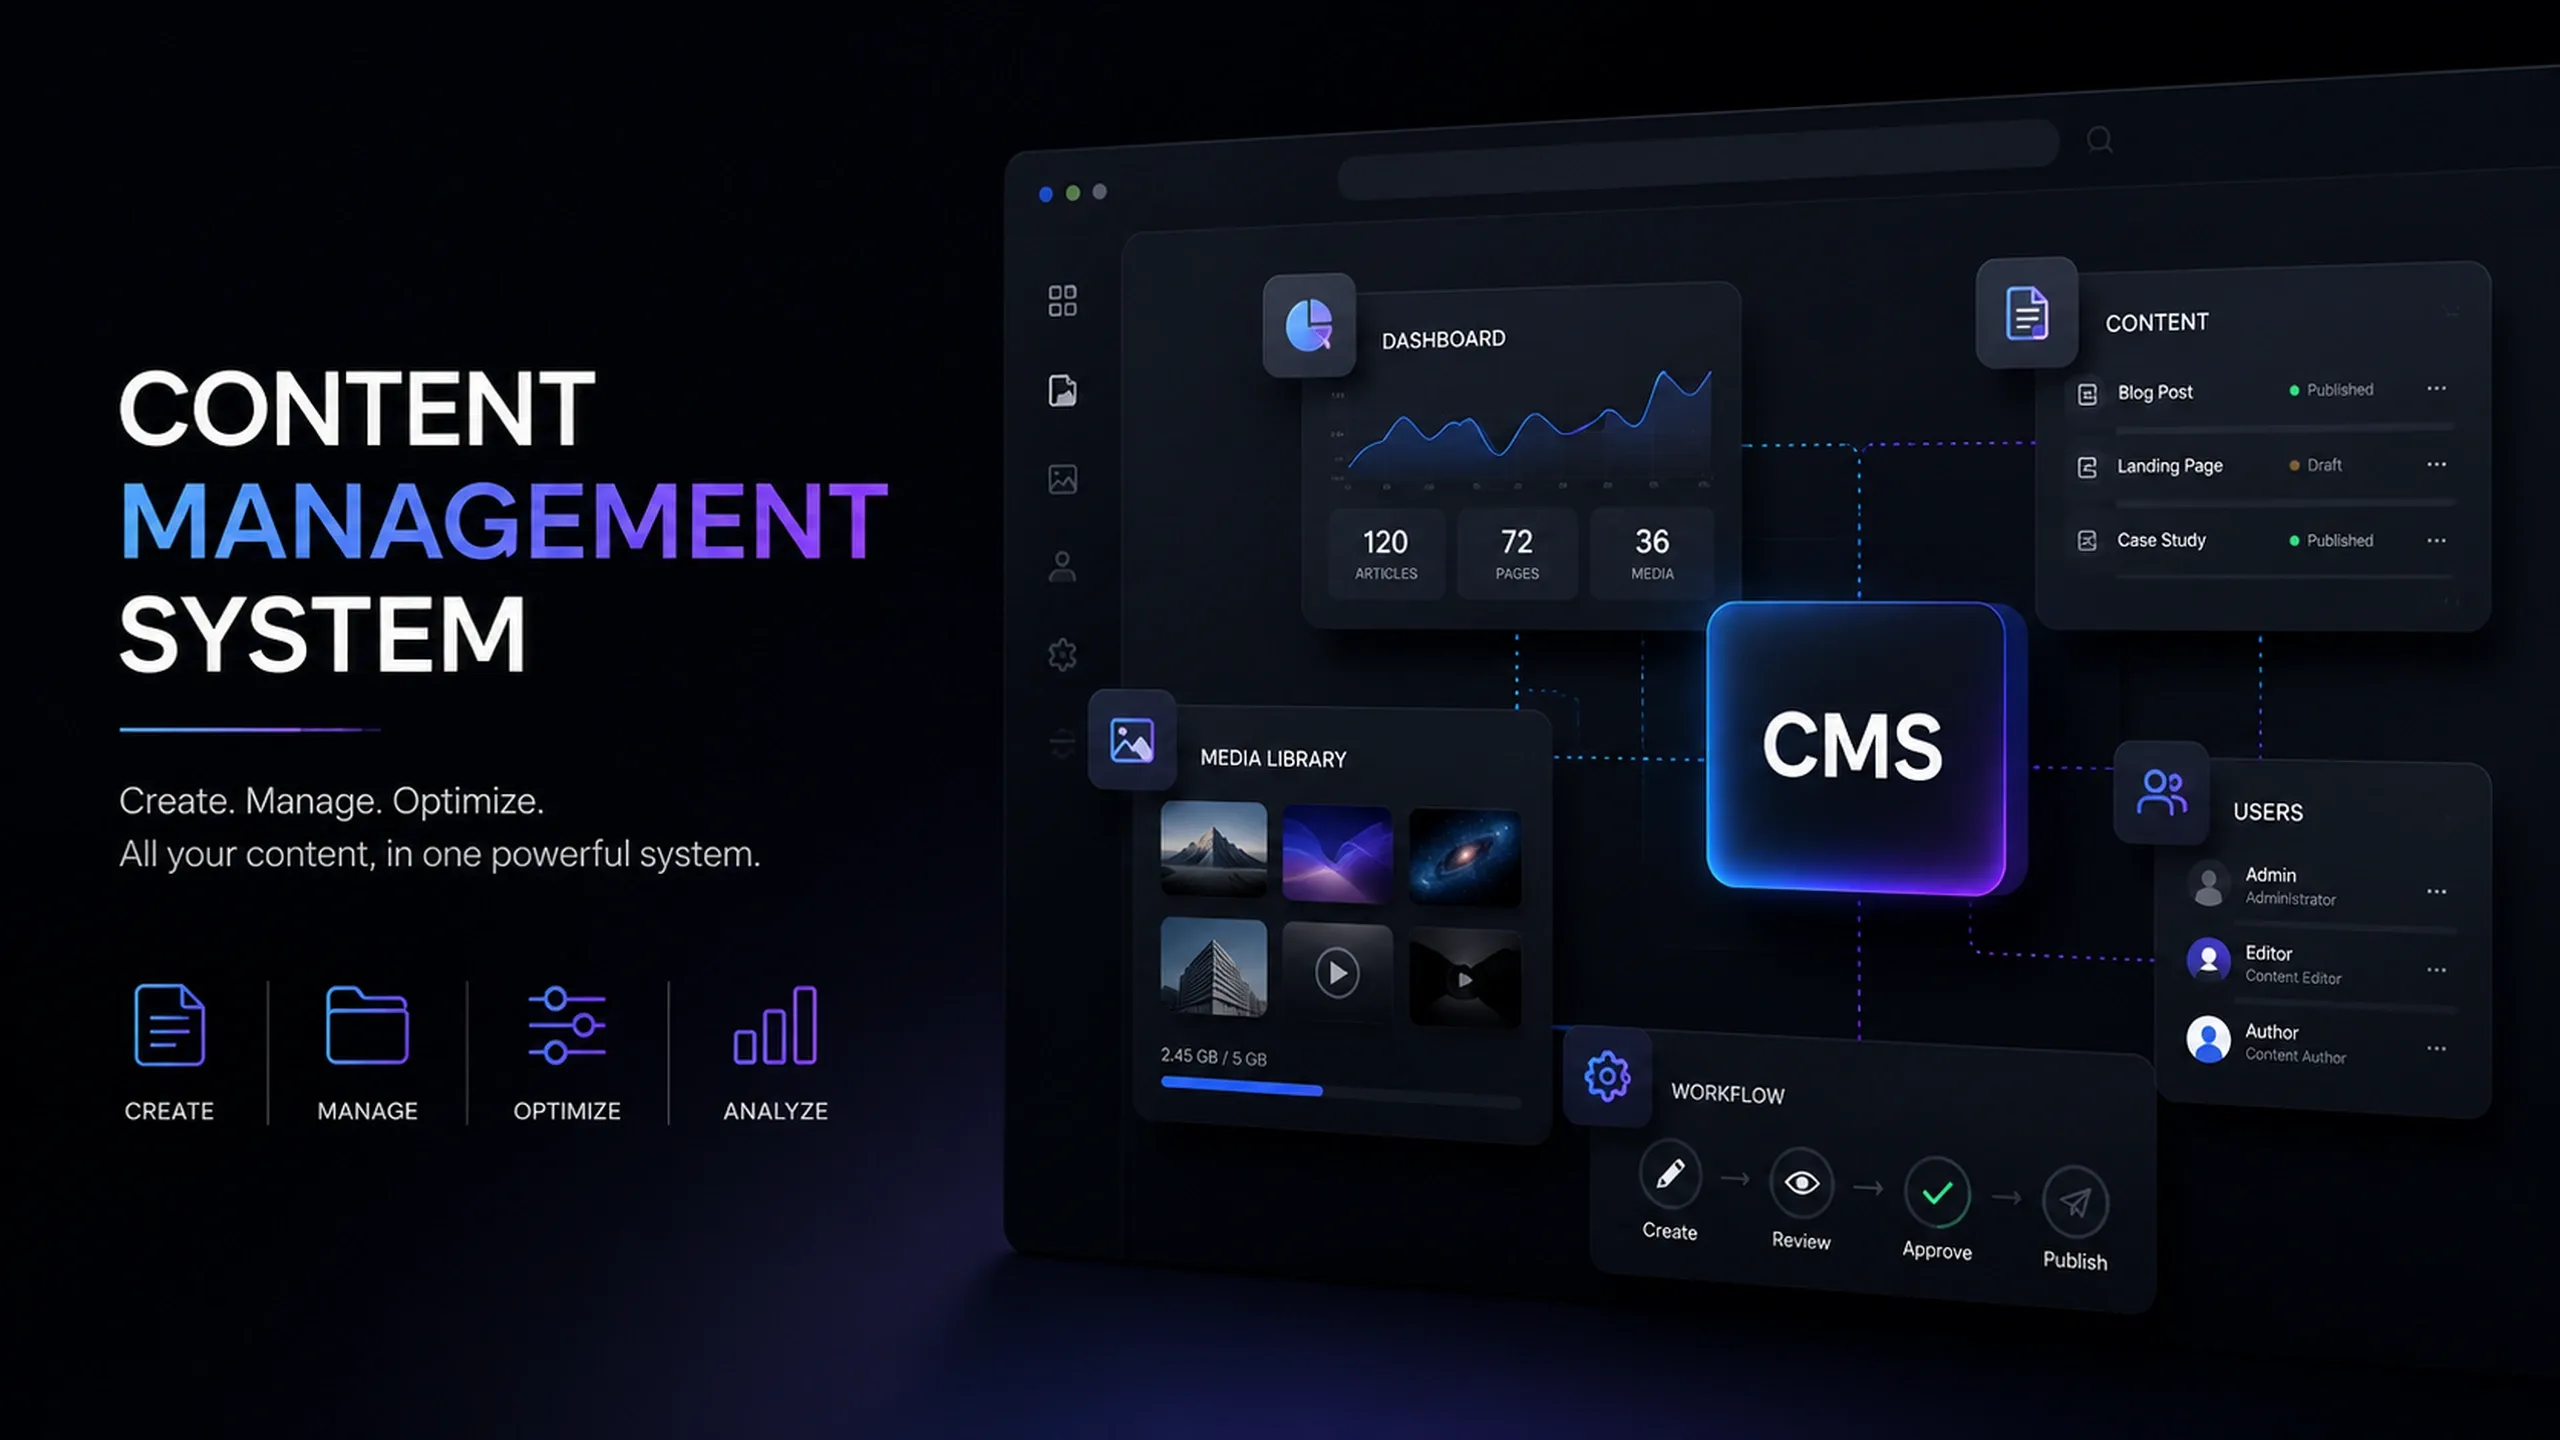
Learn how a content management system helps teams structure, edit, publish, govern, and maintain website content more effectively.
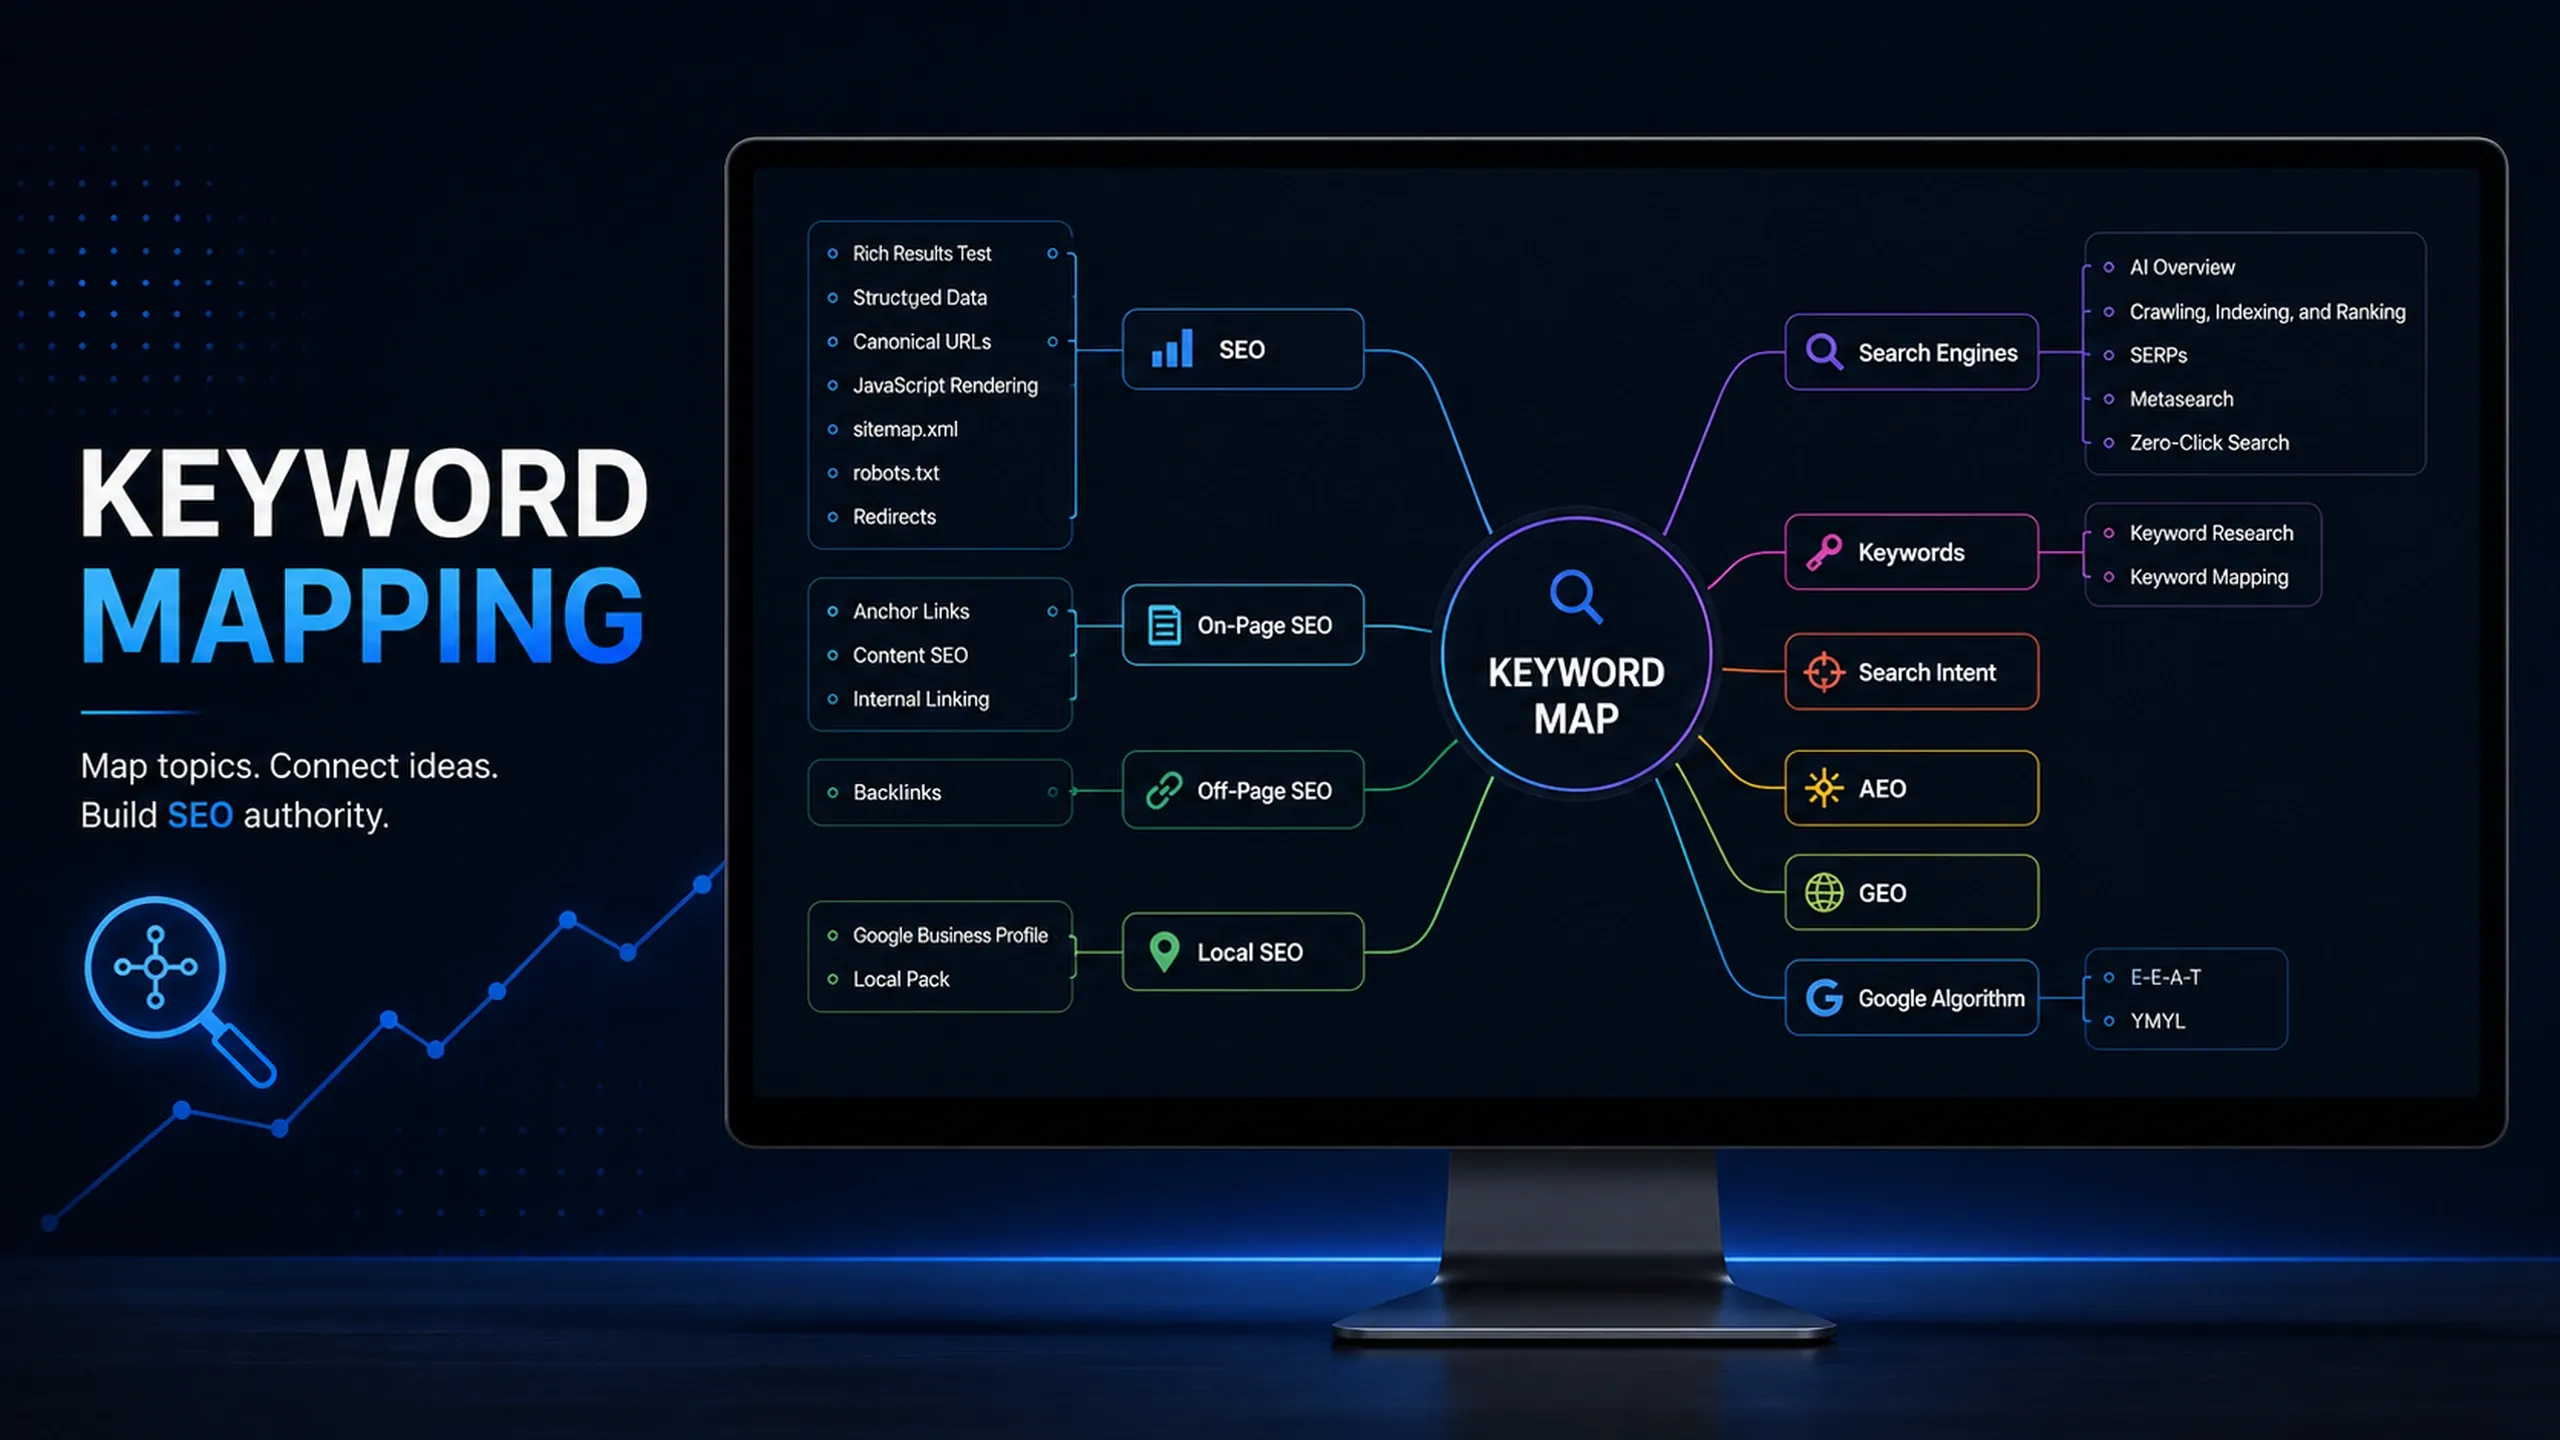
Learn how keyword mapping connects search intent, keyword clusters, page ownership, content planning, and internal linking.

Learn how keyword research connects search intent, content strategy, SEO planning, page mapping, and measurable demand.